Barbadian vs Immigrants from Honduras 3rd Grade
COMPARE
Barbadian
Immigrants from Honduras
3rd Grade
3rd Grade Comparison
Barbadians
Immigrants from Honduras
97.2%
3RD GRADE
0.1/ 100
METRIC RATING
281st/ 347
METRIC RANK
96.3%
3RD GRADE
0.0/ 100
METRIC RATING
329th/ 347
METRIC RANK
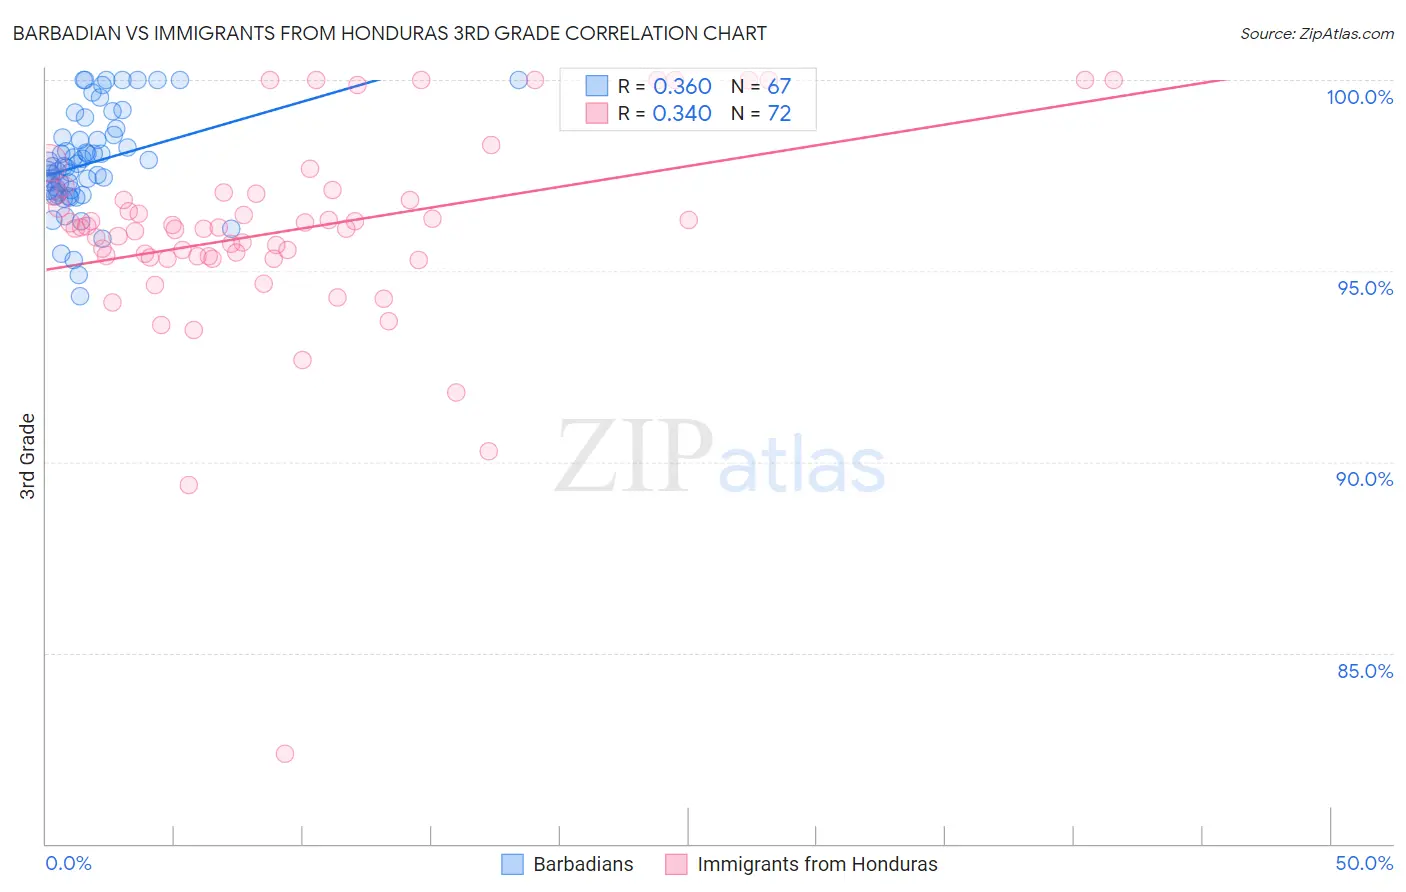
Barbadian vs Immigrants from Honduras 3rd Grade Correlation Chart
The statistical analysis conducted on geographies consisting of 141,304,590 people shows a mild positive correlation between the proportion of Barbadians and percentage of population with at least 3rd grade education in the United States with a correlation coefficient (R) of 0.360 and weighted average of 97.2%. Similarly, the statistical analysis conducted on geographies consisting of 322,637,445 people shows a mild positive correlation between the proportion of Immigrants from Honduras and percentage of population with at least 3rd grade education in the United States with a correlation coefficient (R) of 0.340 and weighted average of 96.3%, a difference of 0.86%.
3rd Grade Correlation Summary
| Measurement | Barbadian | Immigrants from Honduras |
| Minimum | 94.3% | 82.3% |
| Maximum | 100.0% | 100.0% |
| Range | 5.7% | 17.7% |
| Mean | 97.8% | 96.1% |
| Median | 97.7% | 96.1% |
| Interquartile 25% (IQ1) | 97.0% | 95.4% |
| Interquartile 75% (IQ3) | 98.6% | 97.0% |
| Interquartile Range (IQR) | 1.5% | 1.6% |
| Standard Deviation (Sample) | 1.3% | 2.7% |
| Standard Deviation (Population) | 1.3% | 2.7% |
Similar Demographics by 3rd Grade
Demographics Similar to Barbadians by 3rd Grade
In terms of 3rd grade, the demographic groups most similar to Barbadians are Immigrants from Philippines (97.2%, a difference of 0.010%), Immigrants from Ghana (97.2%, a difference of 0.010%), Afghan (97.1%, a difference of 0.010%), Immigrants from Bolivia (97.2%, a difference of 0.020%), and Trinidadian and Tobagonian (97.2%, a difference of 0.020%).
| Demographics | Rating | Rank | 3rd Grade |
| Immigrants | Cameroon | 0.1 /100 | #274 | Tragic 97.2% |
| Immigrants | Uzbekistan | 0.1 /100 | #275 | Tragic 97.2% |
| Immigrants | Bolivia | 0.1 /100 | #276 | Tragic 97.2% |
| Trinidadians and Tobagonians | 0.1 /100 | #277 | Tragic 97.2% |
| Immigrants | Western Africa | 0.1 /100 | #278 | Tragic 97.2% |
| Immigrants | Philippines | 0.1 /100 | #279 | Tragic 97.2% |
| Immigrants | Ghana | 0.1 /100 | #280 | Tragic 97.2% |
| Barbadians | 0.1 /100 | #281 | Tragic 97.2% |
| Afghans | 0.1 /100 | #282 | Tragic 97.1% |
| Houma | 0.1 /100 | #283 | Tragic 97.1% |
| Immigrants | Trinidad and Tobago | 0.0 /100 | #284 | Tragic 97.1% |
| Immigrants | Hong Kong | 0.0 /100 | #285 | Tragic 97.1% |
| Immigrants | Barbados | 0.0 /100 | #286 | Tragic 97.1% |
| Immigrants | St. Vincent and the Grenadines | 0.0 /100 | #287 | Tragic 97.1% |
| Immigrants | West Indies | 0.0 /100 | #288 | Tragic 97.1% |
Demographics Similar to Immigrants from Honduras by 3rd Grade
In terms of 3rd grade, the demographic groups most similar to Immigrants from Honduras are Japanese (96.4%, a difference of 0.020%), Bangladeshi (96.3%, a difference of 0.020%), Immigrants from Vietnam (96.4%, a difference of 0.030%), Mexican American Indian (96.4%, a difference of 0.070%), and Dominican (96.4%, a difference of 0.080%).
| Demographics | Rating | Rank | 3rd Grade |
| Immigrants | Belize | 0.0 /100 | #322 | Tragic 96.5% |
| Hondurans | 0.0 /100 | #323 | Tragic 96.5% |
| Dominicans | 0.0 /100 | #324 | Tragic 96.4% |
| Mexican American Indians | 0.0 /100 | #325 | Tragic 96.4% |
| Immigrants | Vietnam | 0.0 /100 | #326 | Tragic 96.4% |
| Japanese | 0.0 /100 | #327 | Tragic 96.4% |
| Bangladeshis | 0.0 /100 | #328 | Tragic 96.3% |
| Immigrants | Honduras | 0.0 /100 | #329 | Tragic 96.3% |
| Immigrants | Armenia | 0.0 /100 | #330 | Tragic 96.3% |
| Immigrants | Latin America | 0.0 /100 | #331 | Tragic 96.2% |
| Mexicans | 0.0 /100 | #332 | Tragic 96.2% |
| Immigrants | Fiji | 0.0 /100 | #333 | Tragic 96.2% |
| Immigrants | Cambodia | 0.0 /100 | #334 | Tragic 96.2% |
| Immigrants | Dominican Republic | 0.0 /100 | #335 | Tragic 96.2% |
| Immigrants | Cabo Verde | 0.0 /100 | #336 | Tragic 96.2% |