Cypriot vs Immigrants from Honduras 3rd Grade
COMPARE
Cypriot
Immigrants from Honduras
3rd Grade
3rd Grade Comparison
Cypriots
Immigrants from Honduras
98.1%
3RD GRADE
98.4/ 100
METRIC RATING
95th/ 347
METRIC RANK
96.3%
3RD GRADE
0.0/ 100
METRIC RATING
329th/ 347
METRIC RANK
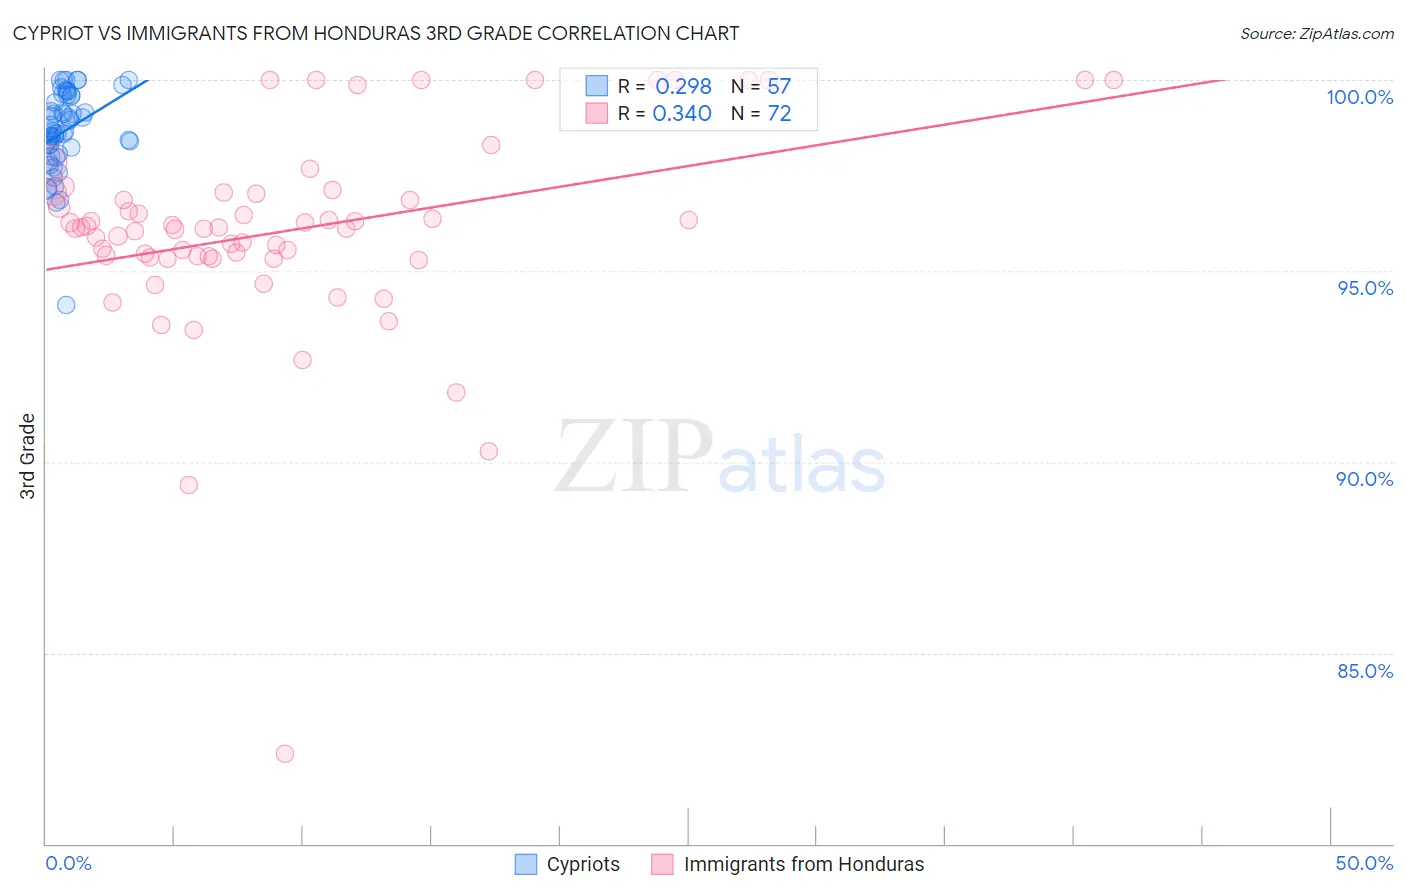
Cypriot vs Immigrants from Honduras 3rd Grade Correlation Chart
The statistical analysis conducted on geographies consisting of 61,870,289 people shows a weak positive correlation between the proportion of Cypriots and percentage of population with at least 3rd grade education in the United States with a correlation coefficient (R) of 0.298 and weighted average of 98.1%. Similarly, the statistical analysis conducted on geographies consisting of 322,637,445 people shows a mild positive correlation between the proportion of Immigrants from Honduras and percentage of population with at least 3rd grade education in the United States with a correlation coefficient (R) of 0.340 and weighted average of 96.3%, a difference of 1.8%.
3rd Grade Correlation Summary
| Measurement | Cypriot | Immigrants from Honduras |
| Minimum | 94.1% | 82.3% |
| Maximum | 100.0% | 100.0% |
| Range | 5.9% | 17.7% |
| Mean | 98.7% | 96.1% |
| Median | 98.7% | 96.1% |
| Interquartile 25% (IQ1) | 98.1% | 95.4% |
| Interquartile 75% (IQ3) | 99.6% | 97.0% |
| Interquartile Range (IQR) | 1.4% | 1.6% |
| Standard Deviation (Sample) | 1.1% | 2.7% |
| Standard Deviation (Population) | 1.1% | 2.7% |
Similar Demographics by 3rd Grade
Demographics Similar to Cypriots by 3rd Grade
In terms of 3rd grade, the demographic groups most similar to Cypriots are Immigrants from Germany (98.1%, a difference of 0.0%), Immigrants from Ireland (98.1%, a difference of 0.010%), South African (98.1%, a difference of 0.010%), Delaware (98.1%, a difference of 0.020%), and Zimbabwean (98.1%, a difference of 0.020%).
| Demographics | Rating | Rank | 3rd Grade |
| Immigrants | India | 98.8 /100 | #88 | Exceptional 98.1% |
| Delaware | 98.8 /100 | #89 | Exceptional 98.1% |
| Zimbabweans | 98.8 /100 | #90 | Exceptional 98.1% |
| Hopi | 98.7 /100 | #91 | Exceptional 98.1% |
| Immigrants | South Africa | 98.7 /100 | #92 | Exceptional 98.1% |
| Immigrants | Western Europe | 98.7 /100 | #93 | Exceptional 98.1% |
| Immigrants | Germany | 98.4 /100 | #94 | Exceptional 98.1% |
| Cypriots | 98.4 /100 | #95 | Exceptional 98.1% |
| Immigrants | Ireland | 98.2 /100 | #96 | Exceptional 98.1% |
| South Africans | 98.2 /100 | #97 | Exceptional 98.1% |
| Choctaw | 98.0 /100 | #98 | Exceptional 98.1% |
| Romanians | 98.0 /100 | #99 | Exceptional 98.1% |
| Cree | 97.9 /100 | #100 | Exceptional 98.1% |
| Puget Sound Salish | 97.9 /100 | #101 | Exceptional 98.1% |
| Immigrants | Nonimmigrants | 97.8 /100 | #102 | Exceptional 98.1% |
Demographics Similar to Immigrants from Honduras by 3rd Grade
In terms of 3rd grade, the demographic groups most similar to Immigrants from Honduras are Japanese (96.4%, a difference of 0.020%), Bangladeshi (96.3%, a difference of 0.020%), Immigrants from Vietnam (96.4%, a difference of 0.030%), Mexican American Indian (96.4%, a difference of 0.070%), and Dominican (96.4%, a difference of 0.080%).
| Demographics | Rating | Rank | 3rd Grade |
| Immigrants | Belize | 0.0 /100 | #322 | Tragic 96.5% |
| Hondurans | 0.0 /100 | #323 | Tragic 96.5% |
| Dominicans | 0.0 /100 | #324 | Tragic 96.4% |
| Mexican American Indians | 0.0 /100 | #325 | Tragic 96.4% |
| Immigrants | Vietnam | 0.0 /100 | #326 | Tragic 96.4% |
| Japanese | 0.0 /100 | #327 | Tragic 96.4% |
| Bangladeshis | 0.0 /100 | #328 | Tragic 96.3% |
| Immigrants | Honduras | 0.0 /100 | #329 | Tragic 96.3% |
| Immigrants | Armenia | 0.0 /100 | #330 | Tragic 96.3% |
| Immigrants | Latin America | 0.0 /100 | #331 | Tragic 96.2% |
| Mexicans | 0.0 /100 | #332 | Tragic 96.2% |
| Immigrants | Fiji | 0.0 /100 | #333 | Tragic 96.2% |
| Immigrants | Cambodia | 0.0 /100 | #334 | Tragic 96.2% |
| Immigrants | Dominican Republic | 0.0 /100 | #335 | Tragic 96.2% |
| Immigrants | Cabo Verde | 0.0 /100 | #336 | Tragic 96.2% |