Immigrants from Syria vs Jamaican Doctorate Degree
COMPARE
Immigrants from Syria
Jamaican
Doctorate Degree
Doctorate Degree Comparison
Immigrants from Syria
Jamaicans
1.9%
DOCTORATE DEGREE
83.6/ 100
METRIC RATING
146th/ 347
METRIC RANK
1.5%
DOCTORATE DEGREE
0.3/ 100
METRIC RATING
284th/ 347
METRIC RANK
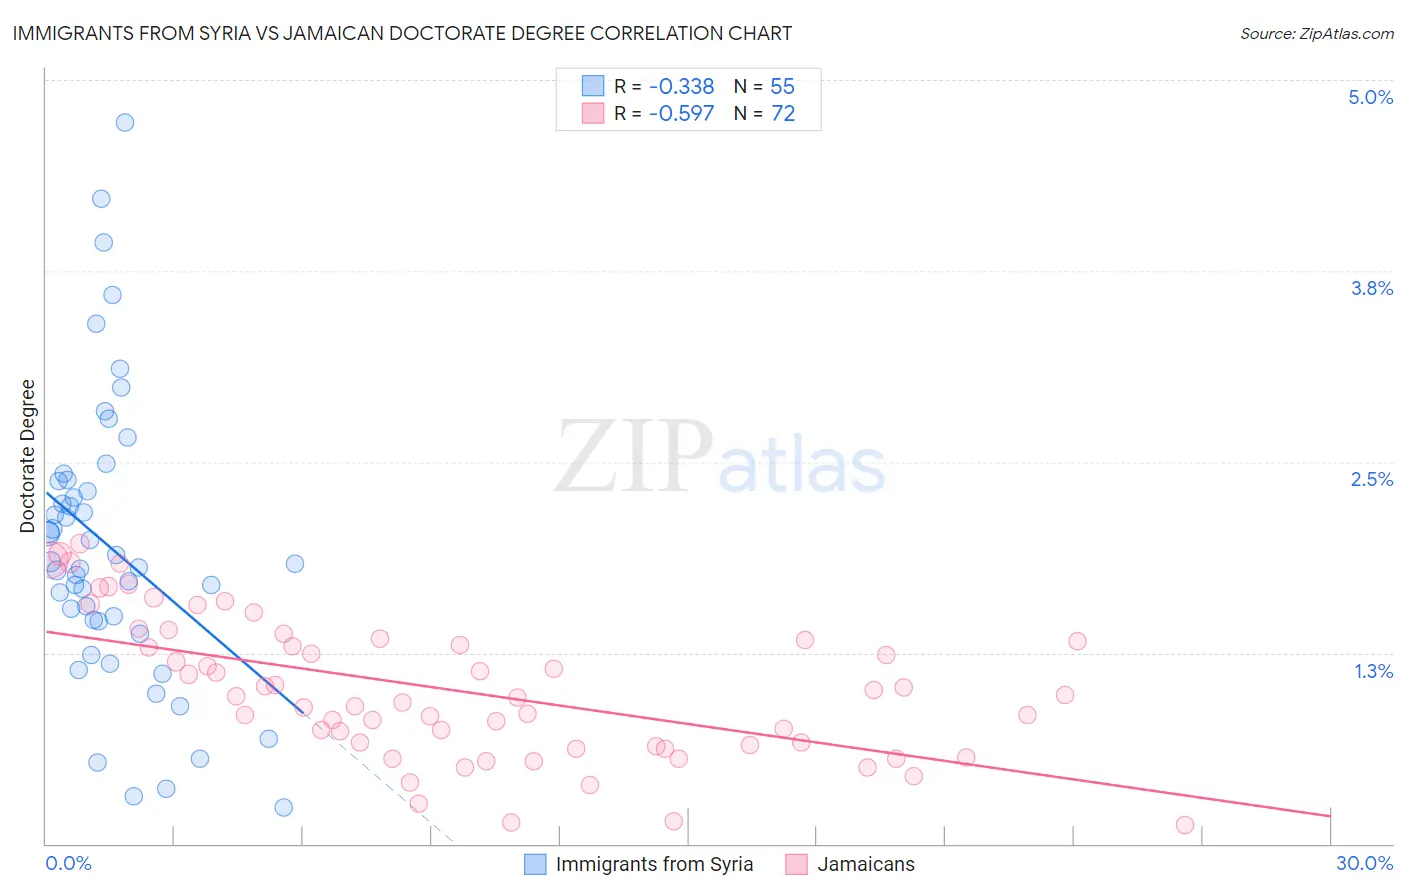
Immigrants from Syria vs Jamaican Doctorate Degree Correlation Chart
The statistical analysis conducted on geographies consisting of 173,800,904 people shows a mild negative correlation between the proportion of Immigrants from Syria and percentage of population with at least doctorate degree education in the United States with a correlation coefficient (R) of -0.338 and weighted average of 1.9%. Similarly, the statistical analysis conducted on geographies consisting of 364,326,977 people shows a substantial negative correlation between the proportion of Jamaicans and percentage of population with at least doctorate degree education in the United States with a correlation coefficient (R) of -0.597 and weighted average of 1.5%, a difference of 33.8%.
Doctorate Degree Correlation Summary
| Measurement | Immigrants from Syria | Jamaican |
| Minimum | 0.24% | 0.12% |
| Maximum | 4.7% | 2.0% |
| Range | 4.5% | 1.8% |
| Mean | 1.9% | 1.0% |
| Median | 1.8% | 0.96% |
| Interquartile 25% (IQ1) | 1.5% | 0.64% |
| Interquartile 75% (IQ3) | 2.4% | 1.3% |
| Interquartile Range (IQR) | 0.92% | 0.69% |
| Standard Deviation (Sample) | 0.94% | 0.46% |
| Standard Deviation (Population) | 0.93% | 0.46% |
Similar Demographics by Doctorate Degree
Demographics Similar to Immigrants from Syria by Doctorate Degree
In terms of doctorate degree, the demographic groups most similar to Immigrants from Syria are Kenyan (1.9%, a difference of 0.020%), Immigrants from Moldova (2.0%, a difference of 0.20%), Immigrants from Senegal (1.9%, a difference of 0.25%), Sierra Leonean (2.0%, a difference of 0.41%), and Luxembourger (1.9%, a difference of 0.58%).
| Demographics | Rating | Rank | Doctorate Degree |
| Afghans | 87.2 /100 | #139 | Excellent 2.0% |
| Immigrants | Africa | 87.0 /100 | #140 | Excellent 2.0% |
| Senegalese | 86.7 /100 | #141 | Excellent 2.0% |
| Italians | 86.0 /100 | #142 | Excellent 2.0% |
| Sierra Leoneans | 85.1 /100 | #143 | Excellent 2.0% |
| Immigrants | Moldova | 84.3 /100 | #144 | Excellent 2.0% |
| Kenyans | 83.6 /100 | #145 | Excellent 1.9% |
| Immigrants | Syria | 83.6 /100 | #146 | Excellent 1.9% |
| Immigrants | Senegal | 82.5 /100 | #147 | Excellent 1.9% |
| Luxembourgers | 81.1 /100 | #148 | Excellent 1.9% |
| Basques | 76.9 /100 | #149 | Good 1.9% |
| English | 75.9 /100 | #150 | Good 1.9% |
| Albanians | 74.8 /100 | #151 | Good 1.9% |
| Immigrants | Kenya | 74.3 /100 | #152 | Good 1.9% |
| Immigrants | Oceania | 74.0 /100 | #153 | Good 1.9% |
Demographics Similar to Jamaicans by Doctorate Degree
In terms of doctorate degree, the demographic groups most similar to Jamaicans are Malaysian (1.5%, a difference of 0.030%), Central American (1.5%, a difference of 0.040%), British West Indian (1.5%, a difference of 0.090%), Tohono O'odham (1.5%, a difference of 0.14%), and Ecuadorian (1.5%, a difference of 0.20%).
| Demographics | Rating | Rank | Doctorate Degree |
| Bahamians | 0.4 /100 | #277 | Tragic 1.5% |
| Hawaiians | 0.4 /100 | #278 | Tragic 1.5% |
| Marshallese | 0.4 /100 | #279 | Tragic 1.5% |
| Ecuadorians | 0.4 /100 | #280 | Tragic 1.5% |
| Tohono O'odham | 0.4 /100 | #281 | Tragic 1.5% |
| British West Indians | 0.3 /100 | #282 | Tragic 1.5% |
| Central Americans | 0.3 /100 | #283 | Tragic 1.5% |
| Jamaicans | 0.3 /100 | #284 | Tragic 1.5% |
| Malaysians | 0.3 /100 | #285 | Tragic 1.5% |
| Cherokee | 0.3 /100 | #286 | Tragic 1.5% |
| Cajuns | 0.3 /100 | #287 | Tragic 1.5% |
| Immigrants | El Salvador | 0.3 /100 | #288 | Tragic 1.4% |
| Cape Verdeans | 0.3 /100 | #289 | Tragic 1.4% |
| Choctaw | 0.3 /100 | #290 | Tragic 1.4% |
| Blacks/African Americans | 0.3 /100 | #291 | Tragic 1.4% |