Immigrants from Syria vs Haitian Doctorate Degree
COMPARE
Immigrants from Syria
Haitian
Doctorate Degree
Doctorate Degree Comparison
Immigrants from Syria
Haitians
1.9%
DOCTORATE DEGREE
83.6/ 100
METRIC RATING
146th/ 347
METRIC RANK
1.3%
DOCTORATE DEGREE
0.0/ 100
METRIC RATING
329th/ 347
METRIC RANK
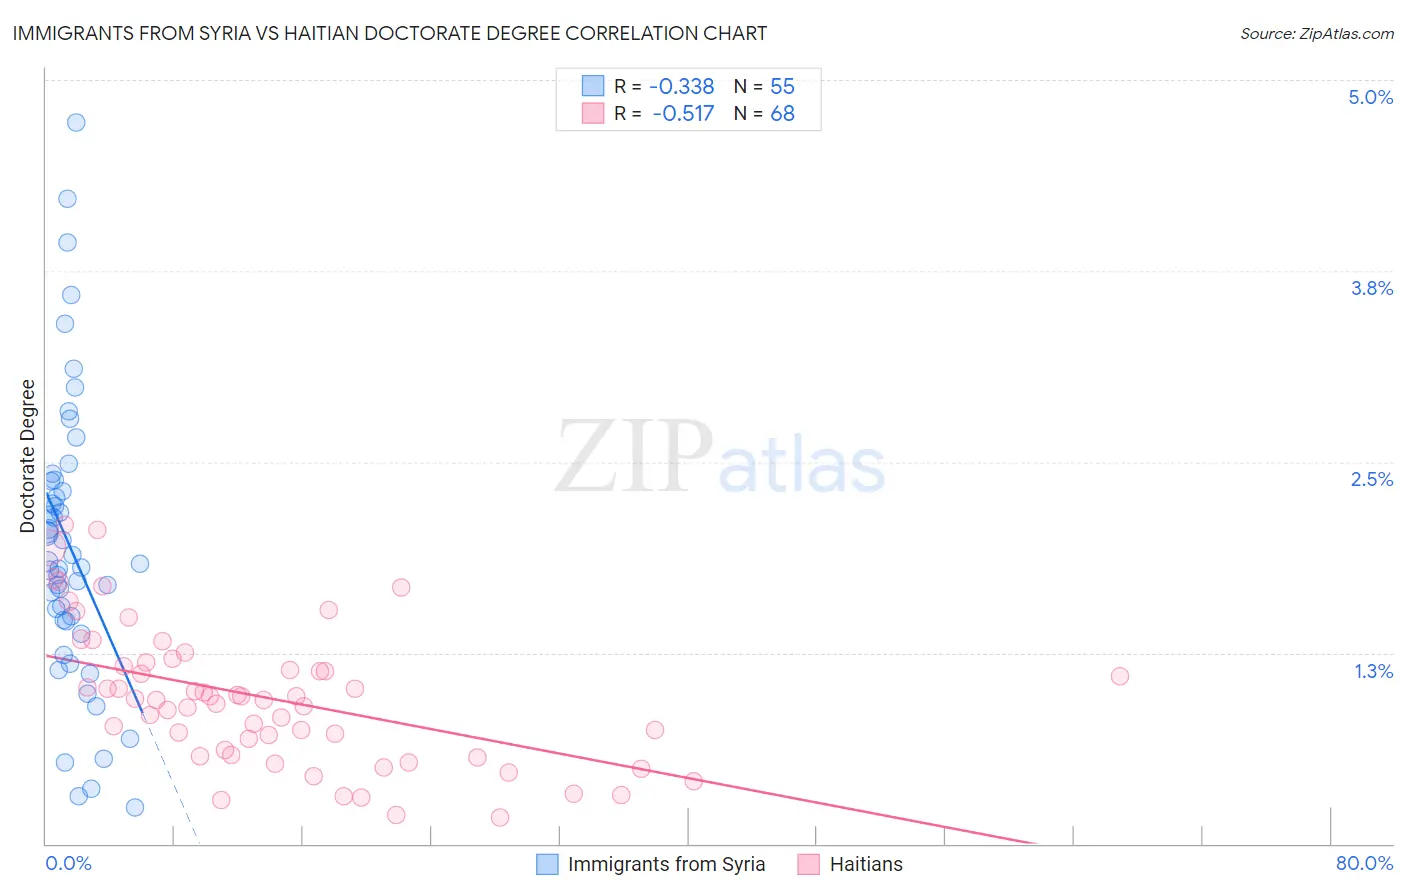
Immigrants from Syria vs Haitian Doctorate Degree Correlation Chart
The statistical analysis conducted on geographies consisting of 173,800,904 people shows a mild negative correlation between the proportion of Immigrants from Syria and percentage of population with at least doctorate degree education in the United States with a correlation coefficient (R) of -0.338 and weighted average of 1.9%. Similarly, the statistical analysis conducted on geographies consisting of 285,866,537 people shows a substantial negative correlation between the proportion of Haitians and percentage of population with at least doctorate degree education in the United States with a correlation coefficient (R) of -0.517 and weighted average of 1.3%, a difference of 49.1%.
Doctorate Degree Correlation Summary
| Measurement | Immigrants from Syria | Haitian |
| Minimum | 0.24% | 0.17% |
| Maximum | 4.7% | 2.1% |
| Range | 4.5% | 1.9% |
| Mean | 1.9% | 0.95% |
| Median | 1.8% | 0.95% |
| Interquartile 25% (IQ1) | 1.5% | 0.60% |
| Interquartile 75% (IQ3) | 2.4% | 1.2% |
| Interquartile Range (IQR) | 0.92% | 0.58% |
| Standard Deviation (Sample) | 0.94% | 0.45% |
| Standard Deviation (Population) | 0.93% | 0.45% |
Similar Demographics by Doctorate Degree
Demographics Similar to Immigrants from Syria by Doctorate Degree
In terms of doctorate degree, the demographic groups most similar to Immigrants from Syria are Kenyan (1.9%, a difference of 0.020%), Immigrants from Moldova (2.0%, a difference of 0.20%), Immigrants from Senegal (1.9%, a difference of 0.25%), Sierra Leonean (2.0%, a difference of 0.41%), and Luxembourger (1.9%, a difference of 0.58%).
| Demographics | Rating | Rank | Doctorate Degree |
| Afghans | 87.2 /100 | #139 | Excellent 2.0% |
| Immigrants | Africa | 87.0 /100 | #140 | Excellent 2.0% |
| Senegalese | 86.7 /100 | #141 | Excellent 2.0% |
| Italians | 86.0 /100 | #142 | Excellent 2.0% |
| Sierra Leoneans | 85.1 /100 | #143 | Excellent 2.0% |
| Immigrants | Moldova | 84.3 /100 | #144 | Excellent 2.0% |
| Kenyans | 83.6 /100 | #145 | Excellent 1.9% |
| Immigrants | Syria | 83.6 /100 | #146 | Excellent 1.9% |
| Immigrants | Senegal | 82.5 /100 | #147 | Excellent 1.9% |
| Luxembourgers | 81.1 /100 | #148 | Excellent 1.9% |
| Basques | 76.9 /100 | #149 | Good 1.9% |
| English | 75.9 /100 | #150 | Good 1.9% |
| Albanians | 74.8 /100 | #151 | Good 1.9% |
| Immigrants | Kenya | 74.3 /100 | #152 | Good 1.9% |
| Immigrants | Oceania | 74.0 /100 | #153 | Good 1.9% |
Demographics Similar to Haitians by Doctorate Degree
In terms of doctorate degree, the demographic groups most similar to Haitians are Inupiat (1.3%, a difference of 0.050%), Yup'ik (1.3%, a difference of 0.22%), Immigrants from Latin America (1.3%, a difference of 0.23%), Hispanic or Latino (1.3%, a difference of 0.63%), and Immigrants from Cabo Verde (1.3%, a difference of 0.92%).
| Demographics | Rating | Rank | Doctorate Degree |
| Seminole | 0.1 /100 | #322 | Tragic 1.3% |
| Immigrants | Belize | 0.1 /100 | #323 | Tragic 1.3% |
| Natives/Alaskans | 0.0 /100 | #324 | Tragic 1.3% |
| Pima | 0.0 /100 | #325 | Tragic 1.3% |
| Immigrants | Cabo Verde | 0.0 /100 | #326 | Tragic 1.3% |
| Hispanics or Latinos | 0.0 /100 | #327 | Tragic 1.3% |
| Inupiat | 0.0 /100 | #328 | Tragic 1.3% |
| Haitians | 0.0 /100 | #329 | Tragic 1.3% |
| Yup'ik | 0.0 /100 | #330 | Tragic 1.3% |
| Immigrants | Latin America | 0.0 /100 | #331 | Tragic 1.3% |
| Yakama | 0.0 /100 | #332 | Tragic 1.3% |
| Immigrants | Caribbean | 0.0 /100 | #333 | Tragic 1.3% |
| Immigrants | Dominican Republic | 0.0 /100 | #334 | Tragic 1.3% |
| Immigrants | Haiti | 0.0 /100 | #335 | Tragic 1.3% |
| Nepalese | 0.0 /100 | #336 | Tragic 1.3% |