Immigrants from Syria vs Jamaican High School Diploma
COMPARE
Immigrants from Syria
Jamaican
High School Diploma
High School Diploma Comparison
Immigrants from Syria
Jamaicans
89.0%
HIGH SCHOOL DIPLOMA
39.2/ 100
METRIC RATING
184th/ 347
METRIC RANK
87.2%
HIGH SCHOOL DIPLOMA
0.3/ 100
METRIC RATING
264th/ 347
METRIC RANK
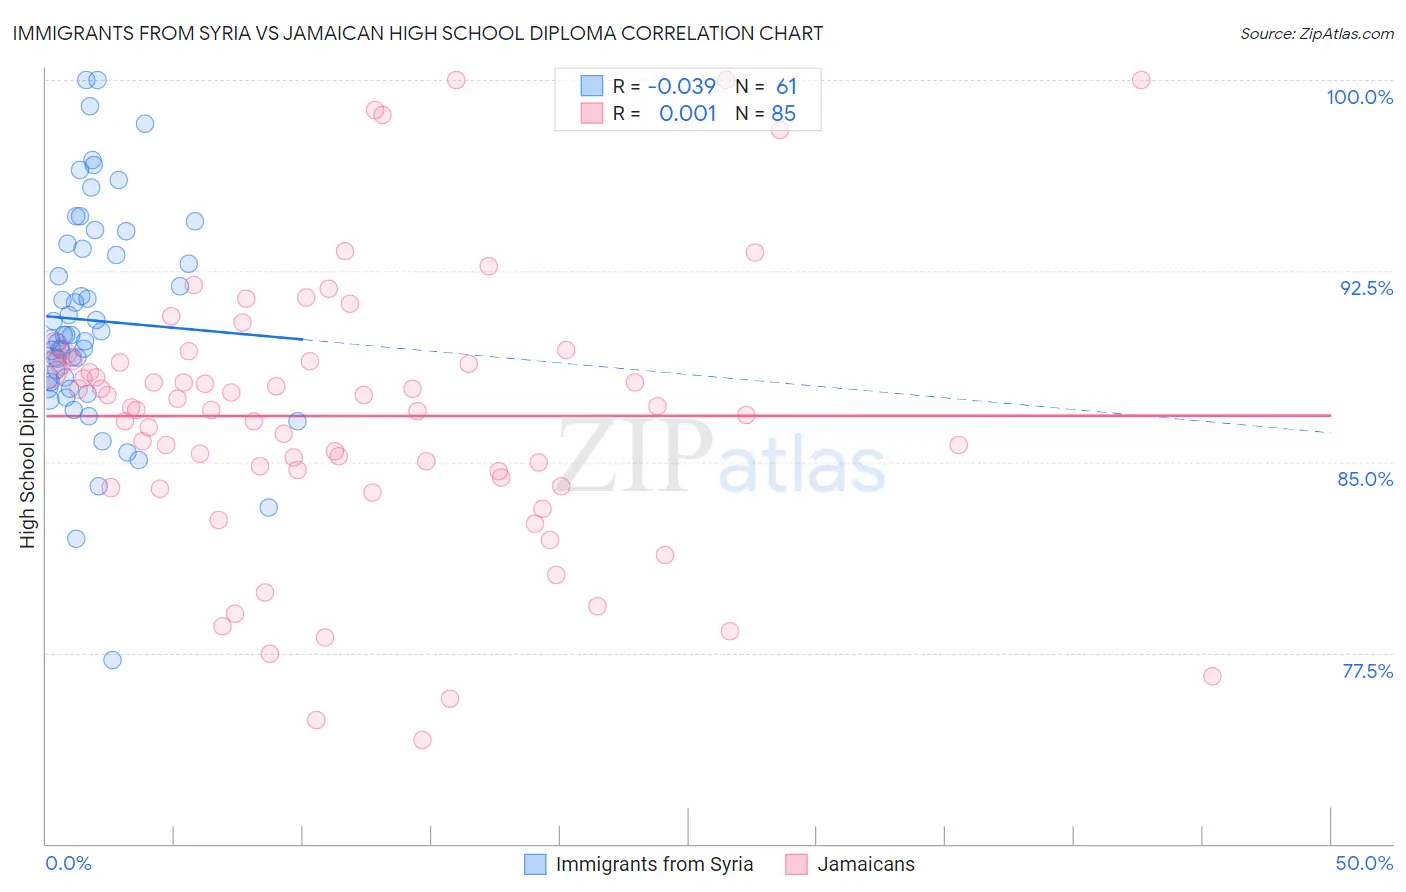
Immigrants from Syria vs Jamaican High School Diploma Correlation Chart
The statistical analysis conducted on geographies consisting of 174,108,882 people shows no correlation between the proportion of Immigrants from Syria and percentage of population with at least high school diploma education in the United States with a correlation coefficient (R) of -0.039 and weighted average of 89.0%. Similarly, the statistical analysis conducted on geographies consisting of 368,084,732 people shows no correlation between the proportion of Jamaicans and percentage of population with at least high school diploma education in the United States with a correlation coefficient (R) of 0.001 and weighted average of 87.2%, a difference of 2.1%.
High School Diploma Correlation Summary
| Measurement | Immigrants from Syria | Jamaican |
| Minimum | 77.2% | 74.1% |
| Maximum | 100.0% | 100.0% |
| Range | 22.8% | 25.9% |
| Mean | 90.6% | 86.8% |
| Median | 90.0% | 87.2% |
| Interquartile 25% (IQ1) | 88.0% | 84.2% |
| Interquartile 75% (IQ3) | 93.5% | 89.0% |
| Interquartile Range (IQR) | 5.4% | 4.8% |
| Standard Deviation (Sample) | 4.4% | 5.4% |
| Standard Deviation (Population) | 4.3% | 5.4% |
Similar Demographics by High School Diploma
Demographics Similar to Immigrants from Syria by High School Diploma
In terms of high school diploma, the demographic groups most similar to Immigrants from Syria are Ethiopian (89.0%, a difference of 0.040%), Potawatomi (89.0%, a difference of 0.050%), Spaniard (89.1%, a difference of 0.060%), Immigrants from Eastern Africa (88.9%, a difference of 0.060%), and Guamanian/Chamorro (88.9%, a difference of 0.060%).
| Demographics | Rating | Rank | High School Diploma |
| Sudanese | 48.5 /100 | #177 | Average 89.1% |
| Sierra Leoneans | 48.4 /100 | #178 | Average 89.1% |
| Americans | 47.2 /100 | #179 | Average 89.1% |
| Bolivians | 45.2 /100 | #180 | Average 89.1% |
| Venezuelans | 43.6 /100 | #181 | Average 89.1% |
| Spaniards | 43.4 /100 | #182 | Average 89.1% |
| Potawatomi | 42.5 /100 | #183 | Average 89.0% |
| Immigrants | Syria | 39.2 /100 | #184 | Fair 89.0% |
| Ethiopians | 37.0 /100 | #185 | Fair 89.0% |
| Immigrants | Eastern Africa | 35.8 /100 | #186 | Fair 88.9% |
| Guamanians/Chamorros | 35.5 /100 | #187 | Fair 88.9% |
| Immigrants | Sudan | 33.4 /100 | #188 | Fair 88.9% |
| Immigrants | Uganda | 32.6 /100 | #189 | Fair 88.9% |
| Immigrants | Chile | 31.9 /100 | #190 | Fair 88.9% |
| Immigrants | Ethiopia | 30.9 /100 | #191 | Fair 88.9% |
Demographics Similar to Jamaicans by High School Diploma
In terms of high school diploma, the demographic groups most similar to Jamaicans are Immigrants from South Eastern Asia (87.2%, a difference of 0.020%), Immigrants from Peru (87.3%, a difference of 0.050%), Seminole (87.3%, a difference of 0.080%), Cajun (87.3%, a difference of 0.10%), and U.S. Virgin Islander (87.1%, a difference of 0.13%).
| Demographics | Rating | Rank | High School Diploma |
| Bahamians | 0.7 /100 | #257 | Tragic 87.5% |
| Immigrants | Ghana | 0.5 /100 | #258 | Tragic 87.4% |
| Immigrants | Western Africa | 0.5 /100 | #259 | Tragic 87.4% |
| Cajuns | 0.4 /100 | #260 | Tragic 87.3% |
| Seminole | 0.4 /100 | #261 | Tragic 87.3% |
| Immigrants | Peru | 0.4 /100 | #262 | Tragic 87.3% |
| Immigrants | South Eastern Asia | 0.3 /100 | #263 | Tragic 87.2% |
| Jamaicans | 0.3 /100 | #264 | Tragic 87.2% |
| U.S. Virgin Islanders | 0.2 /100 | #265 | Tragic 87.1% |
| Immigrants | Congo | 0.2 /100 | #266 | Tragic 87.0% |
| Blacks/African Americans | 0.2 /100 | #267 | Tragic 87.0% |
| Pennsylvania Germans | 0.2 /100 | #268 | Tragic 87.0% |
| Sri Lankans | 0.2 /100 | #269 | Tragic 87.0% |
| Malaysians | 0.2 /100 | #270 | Tragic 87.0% |
| West Indians | 0.1 /100 | #271 | Tragic 86.9% |