Immigrants from Switzerland vs Immigrants from Nepal Female Poverty Among 18-24 Year Olds
COMPARE
Immigrants from Switzerland
Immigrants from Nepal
Female Poverty Among 18-24 Year Olds
Female Poverty Among 18-24 Year Olds Comparison
Immigrants from Switzerland
Immigrants from Nepal
21.8%
FEMALE POVERTY AMONG 18-24 YEAR OLDS
0.1/ 100
METRIC RATING
277th/ 347
METRIC RANK
20.7%
FEMALE POVERTY AMONG 18-24 YEAR OLDS
9.6/ 100
METRIC RATING
218th/ 347
METRIC RANK
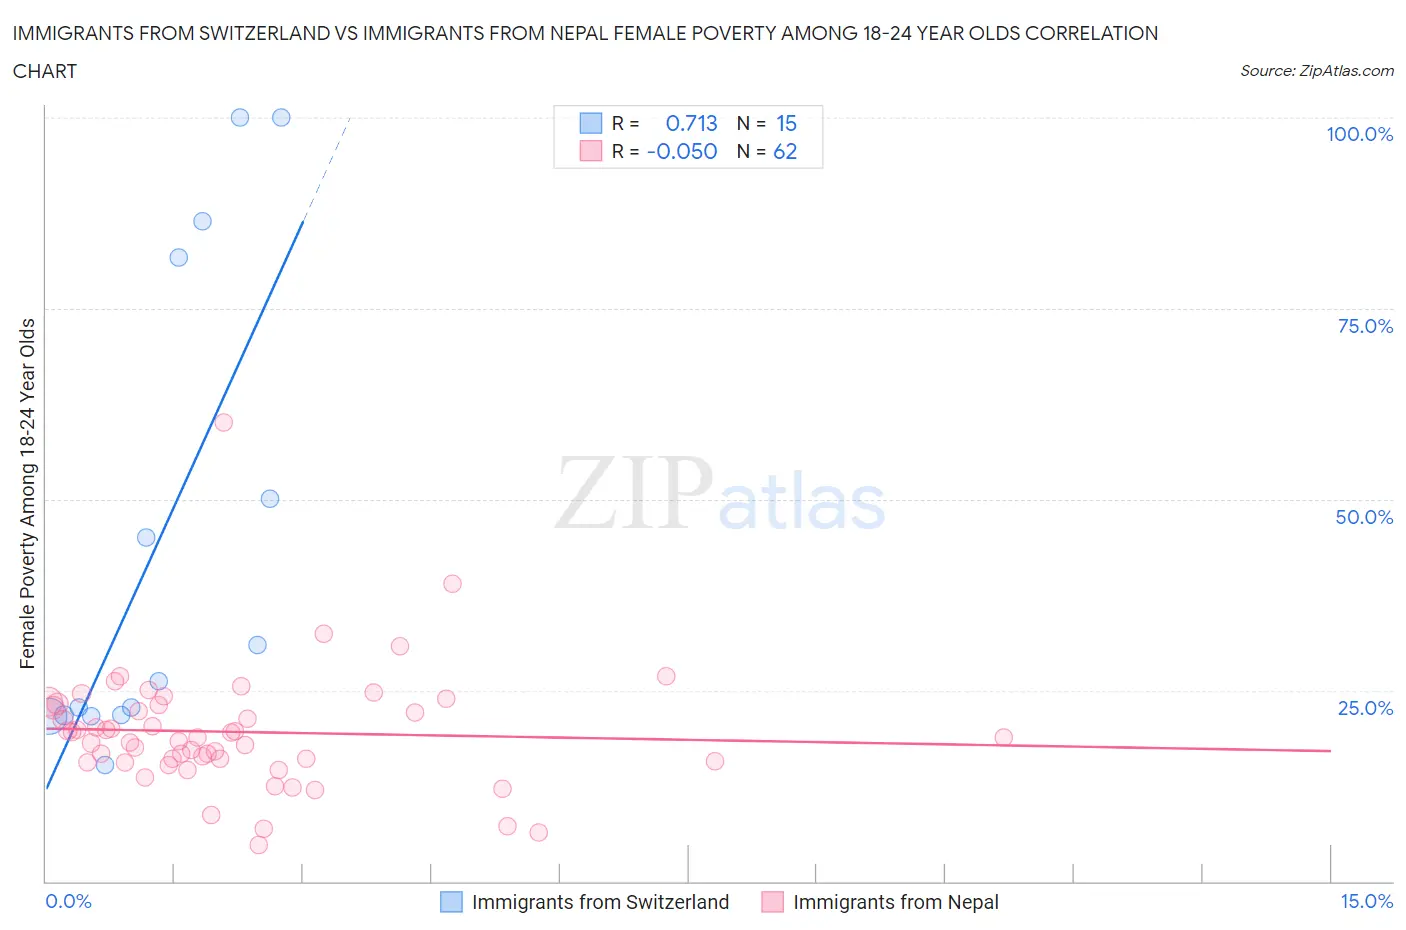
Immigrants from Switzerland vs Immigrants from Nepal Female Poverty Among 18-24 Year Olds Correlation Chart
The statistical analysis conducted on geographies consisting of 145,929,420 people shows a strong positive correlation between the proportion of Immigrants from Switzerland and poverty level among females between the ages 18 and 24 in the United States with a correlation coefficient (R) of 0.713 and weighted average of 21.8%. Similarly, the statistical analysis conducted on geographies consisting of 184,918,180 people shows a slight negative correlation between the proportion of Immigrants from Nepal and poverty level among females between the ages 18 and 24 in the United States with a correlation coefficient (R) of -0.050 and weighted average of 20.7%, a difference of 5.7%.
Female Poverty Among 18-24 Year Olds Correlation Summary
| Measurement | Immigrants from Switzerland | Immigrants from Nepal |
| Minimum | 15.3% | 4.8% |
| Maximum | 100.0% | 60.0% |
| Range | 84.7% | 55.2% |
| Mean | 44.5% | 19.5% |
| Median | 26.2% | 18.8% |
| Interquartile 25% (IQ1) | 21.7% | 15.8% |
| Interquartile 75% (IQ3) | 81.7% | 23.1% |
| Interquartile Range (IQR) | 59.9% | 7.4% |
| Standard Deviation (Sample) | 31.3% | 8.1% |
| Standard Deviation (Population) | 30.3% | 8.0% |
Similar Demographics by Female Poverty Among 18-24 Year Olds
Demographics Similar to Immigrants from Switzerland by Female Poverty Among 18-24 Year Olds
In terms of female poverty among 18-24 year olds, the demographic groups most similar to Immigrants from Switzerland are Bahamian (21.8%, a difference of 0.13%), Immigrants from Bangladesh (21.8%, a difference of 0.15%), Immigrants from Honduras (21.8%, a difference of 0.19%), Yaqui (21.9%, a difference of 0.26%), and Spanish American (21.9%, a difference of 0.43%).
| Demographics | Rating | Rank | Female Poverty Among 18-24 Year Olds |
| Mongolians | 0.2 /100 | #270 | Tragic 21.6% |
| Scotch-Irish | 0.2 /100 | #271 | Tragic 21.6% |
| Basques | 0.2 /100 | #272 | Tragic 21.7% |
| New Zealanders | 0.2 /100 | #273 | Tragic 21.7% |
| Immigrants | Honduras | 0.1 /100 | #274 | Tragic 21.8% |
| Immigrants | Bangladesh | 0.1 /100 | #275 | Tragic 21.8% |
| Bahamians | 0.1 /100 | #276 | Tragic 21.8% |
| Immigrants | Switzerland | 0.1 /100 | #277 | Tragic 21.8% |
| Yaqui | 0.1 /100 | #278 | Tragic 21.9% |
| Spanish Americans | 0.1 /100 | #279 | Tragic 21.9% |
| Immigrants | Dominica | 0.1 /100 | #280 | Tragic 21.9% |
| Immigrants | Dominican Republic | 0.1 /100 | #281 | Tragic 21.9% |
| Bermudans | 0.1 /100 | #282 | Tragic 21.9% |
| Sub-Saharan Africans | 0.0 /100 | #283 | Tragic 22.0% |
| Tlingit-Haida | 0.0 /100 | #284 | Tragic 22.0% |
Demographics Similar to Immigrants from Nepal by Female Poverty Among 18-24 Year Olds
In terms of female poverty among 18-24 year olds, the demographic groups most similar to Immigrants from Nepal are Immigrants from Laos (20.6%, a difference of 0.010%), Immigrants from Micronesia (20.7%, a difference of 0.010%), British (20.7%, a difference of 0.030%), Immigrants from Western Africa (20.6%, a difference of 0.080%), and Spanish (20.6%, a difference of 0.10%).
| Demographics | Rating | Rank | Female Poverty Among 18-24 Year Olds |
| Immigrants | Western Europe | 13.5 /100 | #211 | Poor 20.6% |
| Liberians | 11.6 /100 | #212 | Poor 20.6% |
| Northern Europeans | 11.6 /100 | #213 | Poor 20.6% |
| Immigrants | South Africa | 10.7 /100 | #214 | Poor 20.6% |
| Spanish | 10.4 /100 | #215 | Poor 20.6% |
| Immigrants | Western Africa | 10.2 /100 | #216 | Poor 20.6% |
| Immigrants | Laos | 9.7 /100 | #217 | Tragic 20.6% |
| Immigrants | Nepal | 9.6 /100 | #218 | Tragic 20.7% |
| Immigrants | Micronesia | 9.6 /100 | #219 | Tragic 20.7% |
| British | 9.4 /100 | #220 | Tragic 20.7% |
| Barbadians | 9.0 /100 | #221 | Tragic 20.7% |
| Guatemalans | 8.1 /100 | #222 | Tragic 20.7% |
| French | 7.9 /100 | #223 | Tragic 20.7% |
| Immigrants | Liberia | 7.6 /100 | #224 | Tragic 20.7% |
| Norwegians | 7.3 /100 | #225 | Tragic 20.7% |