Immigrants from Switzerland vs Immigrants from Venezuela 12th Grade, No Diploma
COMPARE
Immigrants from Switzerland
Immigrants from Venezuela
12th Grade, No Diploma
12th Grade, No Diploma Comparison
Immigrants from Switzerland
Immigrants from Venezuela
92.5%
12TH GRADE, NO DIPLOMA
99.2/ 100
METRIC RATING
82nd/ 347
METRIC RANK
91.6%
12TH GRADE, NO DIPLOMA
80.9/ 100
METRIC RATING
142nd/ 347
METRIC RANK
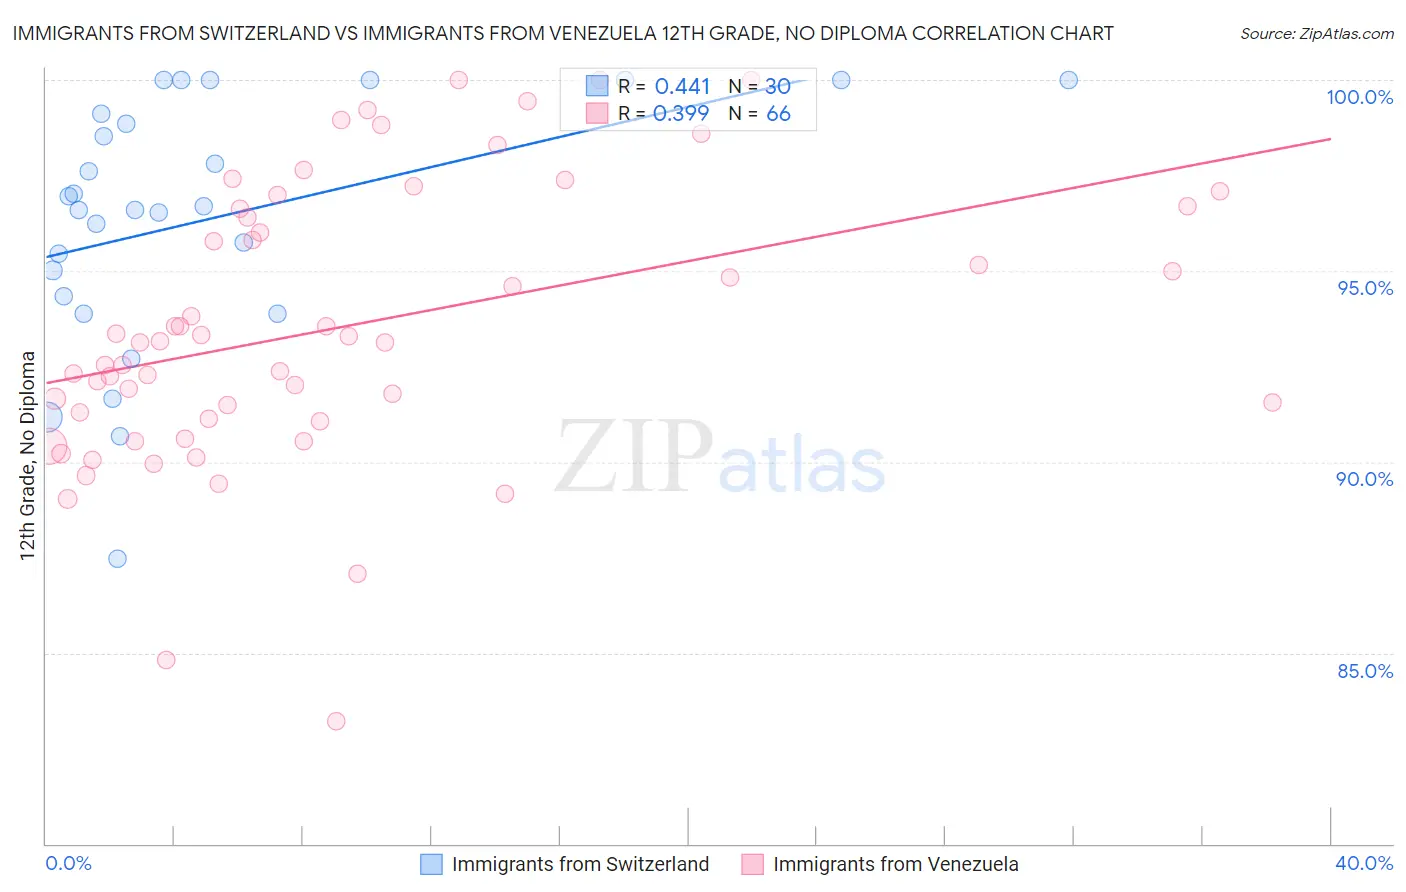
Immigrants from Switzerland vs Immigrants from Venezuela 12th Grade, No Diploma Correlation Chart
The statistical analysis conducted on geographies consisting of 148,083,583 people shows a moderate positive correlation between the proportion of Immigrants from Switzerland and percentage of population with at least 12th grade (no diploma) education in the United States with a correlation coefficient (R) of 0.441 and weighted average of 92.5%. Similarly, the statistical analysis conducted on geographies consisting of 287,866,258 people shows a mild positive correlation between the proportion of Immigrants from Venezuela and percentage of population with at least 12th grade (no diploma) education in the United States with a correlation coefficient (R) of 0.399 and weighted average of 91.6%, a difference of 1.1%.
12th Grade, No Diploma Correlation Summary
| Measurement | Immigrants from Switzerland | Immigrants from Venezuela |
| Minimum | 87.5% | 83.2% |
| Maximum | 100.0% | 100.0% |
| Range | 12.5% | 16.8% |
| Mean | 96.3% | 93.5% |
| Median | 96.6% | 93.1% |
| Interquartile 25% (IQ1) | 94.3% | 91.1% |
| Interquartile 75% (IQ3) | 99.1% | 96.6% |
| Interquartile Range (IQR) | 4.8% | 5.5% |
| Standard Deviation (Sample) | 3.3% | 3.6% |
| Standard Deviation (Population) | 3.2% | 3.6% |
Similar Demographics by 12th Grade, No Diploma
Demographics Similar to Immigrants from Switzerland by 12th Grade, No Diploma
In terms of 12th grade, no diploma, the demographic groups most similar to Immigrants from Switzerland are Immigrants from Denmark (92.5%, a difference of 0.0%), Immigrants from Israel (92.5%, a difference of 0.010%), French Canadian (92.6%, a difference of 0.020%), Cambodian (92.6%, a difference of 0.040%), and Romanian (92.6%, a difference of 0.040%).
| Demographics | Rating | Rank | 12th Grade, No Diploma |
| Native Hawaiians | 99.4 /100 | #75 | Exceptional 92.6% |
| French | 99.4 /100 | #76 | Exceptional 92.6% |
| Immigrants | England | 99.4 /100 | #77 | Exceptional 92.6% |
| Cambodians | 99.3 /100 | #78 | Exceptional 92.6% |
| Romanians | 99.3 /100 | #79 | Exceptional 92.6% |
| French Canadians | 99.3 /100 | #80 | Exceptional 92.6% |
| Immigrants | Denmark | 99.2 /100 | #81 | Exceptional 92.5% |
| Immigrants | Switzerland | 99.2 /100 | #82 | Exceptional 92.5% |
| Immigrants | Israel | 99.2 /100 | #83 | Exceptional 92.5% |
| Immigrants | Bulgaria | 99.1 /100 | #84 | Exceptional 92.5% |
| Immigrants | Saudi Arabia | 99.0 /100 | #85 | Exceptional 92.5% |
| Immigrants | Turkey | 98.9 /100 | #86 | Exceptional 92.4% |
| Immigrants | France | 98.8 /100 | #87 | Exceptional 92.4% |
| Scotch-Irish | 98.8 /100 | #88 | Exceptional 92.4% |
| Canadians | 98.7 /100 | #89 | Exceptional 92.4% |
Demographics Similar to Immigrants from Venezuela by 12th Grade, No Diploma
In terms of 12th grade, no diploma, the demographic groups most similar to Immigrants from Venezuela are Immigrants from Argentina (91.6%, a difference of 0.0%), Argentinean (91.6%, a difference of 0.020%), Immigrants from Spain (91.6%, a difference of 0.020%), Immigrants from Lebanon (91.6%, a difference of 0.020%), and Immigrants from Brazil (91.5%, a difference of 0.020%).
| Demographics | Rating | Rank | 12th Grade, No Diploma |
| Immigrants | Bosnia and Herzegovina | 87.3 /100 | #135 | Excellent 91.7% |
| Chileans | 85.8 /100 | #136 | Excellent 91.7% |
| Alaska Natives | 84.9 /100 | #137 | Excellent 91.6% |
| Arabs | 84.1 /100 | #138 | Excellent 91.6% |
| Immigrants | Egypt | 83.9 /100 | #139 | Excellent 91.6% |
| Immigrants | Poland | 82.3 /100 | #140 | Excellent 91.6% |
| Argentineans | 82.0 /100 | #141 | Excellent 91.6% |
| Immigrants | Venezuela | 80.9 /100 | #142 | Excellent 91.6% |
| Immigrants | Argentina | 80.7 /100 | #143 | Excellent 91.6% |
| Immigrants | Spain | 80.1 /100 | #144 | Excellent 91.6% |
| Immigrants | Lebanon | 80.0 /100 | #145 | Excellent 91.6% |
| Immigrants | Brazil | 79.8 /100 | #146 | Good 91.5% |
| Pakistanis | 79.6 /100 | #147 | Good 91.5% |
| Indians (Asian) | 79.4 /100 | #148 | Good 91.5% |
| Ugandans | 79.0 /100 | #149 | Good 91.5% |