Immigrants from Switzerland vs Native Hawaiian 12th Grade, No Diploma
COMPARE
Immigrants from Switzerland
Native Hawaiian
12th Grade, No Diploma
12th Grade, No Diploma Comparison
Immigrants from Switzerland
Native Hawaiians
92.5%
12TH GRADE, NO DIPLOMA
99.2/ 100
METRIC RATING
82nd/ 347
METRIC RANK
92.6%
12TH GRADE, NO DIPLOMA
99.4/ 100
METRIC RATING
75th/ 347
METRIC RANK
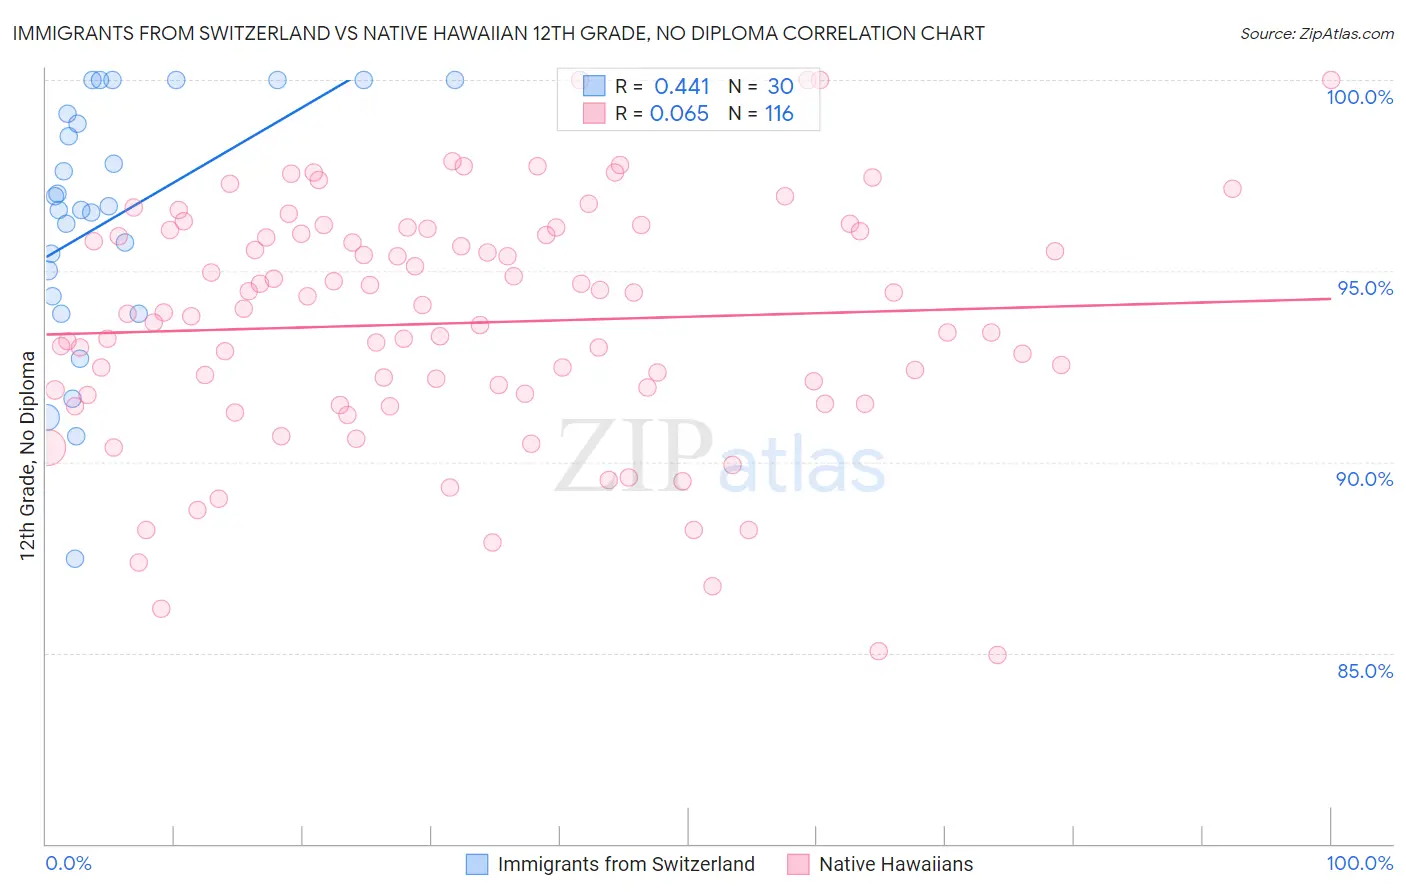
Immigrants from Switzerland vs Native Hawaiian 12th Grade, No Diploma Correlation Chart
The statistical analysis conducted on geographies consisting of 148,083,583 people shows a moderate positive correlation between the proportion of Immigrants from Switzerland and percentage of population with at least 12th grade (no diploma) education in the United States with a correlation coefficient (R) of 0.441 and weighted average of 92.5%. Similarly, the statistical analysis conducted on geographies consisting of 332,119,254 people shows a slight positive correlation between the proportion of Native Hawaiians and percentage of population with at least 12th grade (no diploma) education in the United States with a correlation coefficient (R) of 0.065 and weighted average of 92.6%, a difference of 0.090%.
12th Grade, No Diploma Correlation Summary
| Measurement | Immigrants from Switzerland | Native Hawaiian |
| Minimum | 87.5% | 84.9% |
| Maximum | 100.0% | 100.0% |
| Range | 12.5% | 15.1% |
| Mean | 96.3% | 93.6% |
| Median | 96.6% | 93.9% |
| Interquartile 25% (IQ1) | 94.3% | 91.8% |
| Interquartile 75% (IQ3) | 99.1% | 96.0% |
| Interquartile Range (IQR) | 4.8% | 4.2% |
| Standard Deviation (Sample) | 3.3% | 3.2% |
| Standard Deviation (Population) | 3.2% | 3.2% |
Demographics Similar to Immigrants from Switzerland and Native Hawaiians by 12th Grade, No Diploma
In terms of 12th grade, no diploma, the demographic groups most similar to Immigrants from Switzerland are Immigrants from Denmark (92.5%, a difference of 0.0%), Immigrants from Israel (92.5%, a difference of 0.010%), French Canadian (92.6%, a difference of 0.020%), Cambodian (92.6%, a difference of 0.040%), and Romanian (92.6%, a difference of 0.040%). Similarly, the demographic groups most similar to Native Hawaiians are Burmese (92.6%, a difference of 0.0%), Immigrants from Moldova (92.6%, a difference of 0.0%), French (92.6%, a difference of 0.0%), Immigrants from South Central Asia (92.6%, a difference of 0.020%), and Immigrants from England (92.6%, a difference of 0.020%).
| Demographics | Rating | Rank | 12th Grade, No Diploma |
| Immigrants | Czechoslovakia | 99.5 /100 | #68 | Exceptional 92.7% |
| Immigrants | Iran | 99.5 /100 | #69 | Exceptional 92.7% |
| Czechoslovakians | 99.5 /100 | #70 | Exceptional 92.6% |
| Immigrants | Latvia | 99.5 /100 | #71 | Exceptional 92.6% |
| Immigrants | South Central Asia | 99.5 /100 | #72 | Exceptional 92.6% |
| Burmese | 99.4 /100 | #73 | Exceptional 92.6% |
| Immigrants | Moldova | 99.4 /100 | #74 | Exceptional 92.6% |
| Native Hawaiians | 99.4 /100 | #75 | Exceptional 92.6% |
| French | 99.4 /100 | #76 | Exceptional 92.6% |
| Immigrants | England | 99.4 /100 | #77 | Exceptional 92.6% |
| Cambodians | 99.3 /100 | #78 | Exceptional 92.6% |
| Romanians | 99.3 /100 | #79 | Exceptional 92.6% |
| French Canadians | 99.3 /100 | #80 | Exceptional 92.6% |
| Immigrants | Denmark | 99.2 /100 | #81 | Exceptional 92.5% |
| Immigrants | Switzerland | 99.2 /100 | #82 | Exceptional 92.5% |
| Immigrants | Israel | 99.2 /100 | #83 | Exceptional 92.5% |
| Immigrants | Bulgaria | 99.1 /100 | #84 | Exceptional 92.5% |
| Immigrants | Saudi Arabia | 99.0 /100 | #85 | Exceptional 92.5% |
| Immigrants | Turkey | 98.9 /100 | #86 | Exceptional 92.4% |
| Immigrants | France | 98.8 /100 | #87 | Exceptional 92.4% |
| Scotch-Irish | 98.8 /100 | #88 | Exceptional 92.4% |