Immigrants from Sweden vs Jordanian Associate's Degree
COMPARE
Immigrants from Sweden
Jordanian
Associate's Degree
Associate's Degree Comparison
Immigrants from Sweden
Jordanians
54.6%
ASSOCIATE'S DEGREE
100.0/ 100
METRIC RATING
21st/ 347
METRIC RANK
49.2%
ASSOCIATE'S DEGREE
96.6/ 100
METRIC RATING
108th/ 347
METRIC RANK
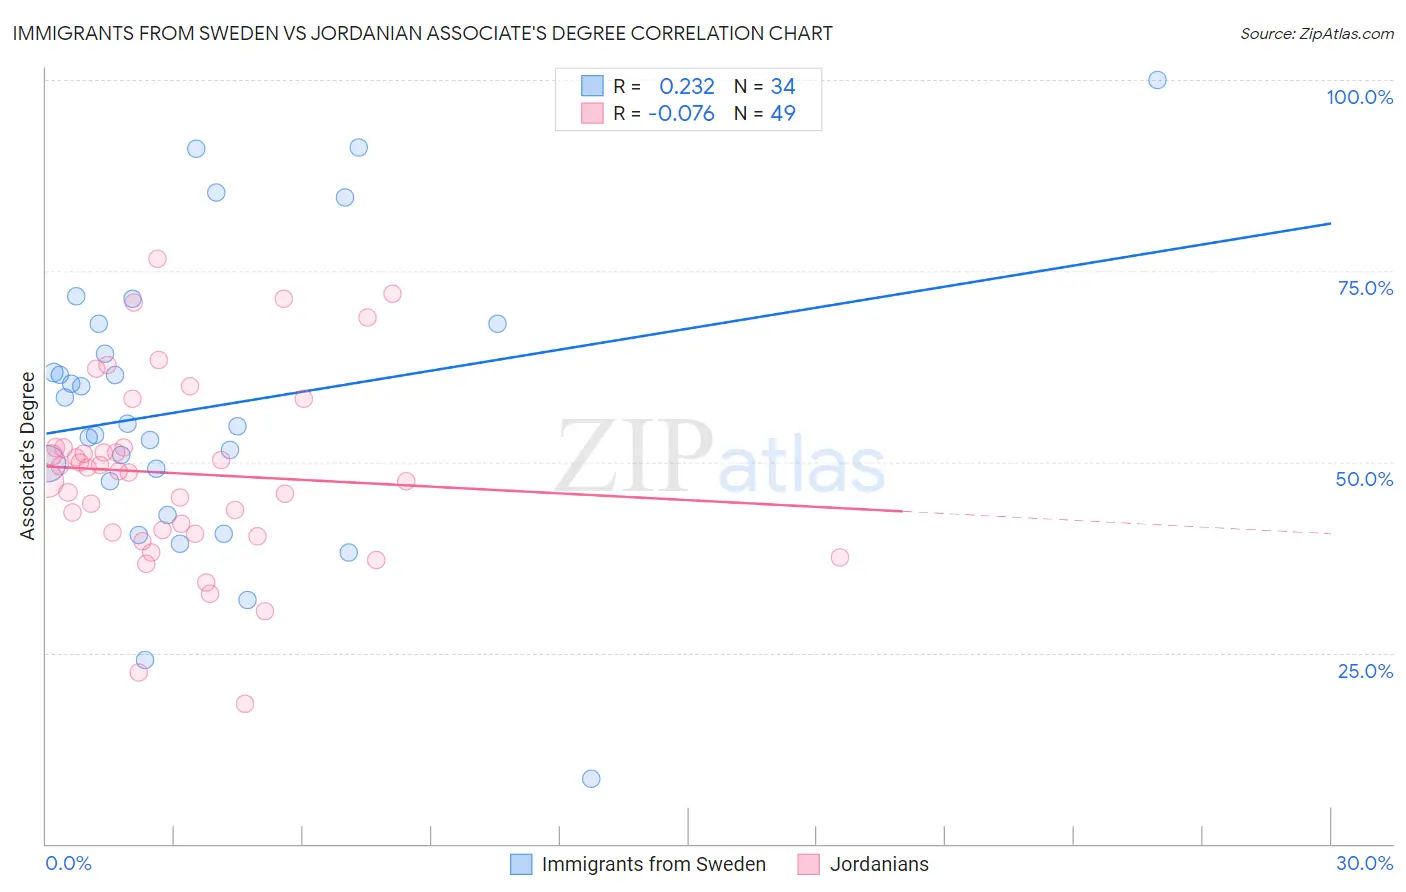
Immigrants from Sweden vs Jordanian Associate's Degree Correlation Chart
The statistical analysis conducted on geographies consisting of 164,727,727 people shows a weak positive correlation between the proportion of Immigrants from Sweden and percentage of population with at least associate's degree education in the United States with a correlation coefficient (R) of 0.232 and weighted average of 54.6%. Similarly, the statistical analysis conducted on geographies consisting of 166,424,117 people shows a slight negative correlation between the proportion of Jordanians and percentage of population with at least associate's degree education in the United States with a correlation coefficient (R) of -0.076 and weighted average of 49.2%, a difference of 10.9%.
Associate's Degree Correlation Summary
| Measurement | Immigrants from Sweden | Jordanian |
| Minimum | 8.6% | 18.4% |
| Maximum | 100.0% | 76.6% |
| Range | 91.4% | 58.2% |
| Mean | 57.1% | 48.5% |
| Median | 54.8% | 48.8% |
| Interquartile 25% (IQ1) | 47.4% | 40.7% |
| Interquartile 75% (IQ3) | 68.1% | 51.9% |
| Interquartile Range (IQR) | 20.7% | 11.1% |
| Standard Deviation (Sample) | 19.3% | 12.2% |
| Standard Deviation (Population) | 19.0% | 12.0% |
Similar Demographics by Associate's Degree
Demographics Similar to Immigrants from Sweden by Associate's Degree
In terms of associate's degree, the demographic groups most similar to Immigrants from Sweden are Immigrants from Japan (54.6%, a difference of 0.030%), Burmese (54.6%, a difference of 0.030%), Cambodian (54.6%, a difference of 0.060%), Immigrants from Ireland (54.7%, a difference of 0.090%), and Immigrants from Korea (54.5%, a difference of 0.12%).
| Demographics | Rating | Rank | Associate's Degree |
| Immigrants | Hong Kong | 100.0 /100 | #14 | Exceptional 55.4% |
| Immigrants | Eastern Asia | 100.0 /100 | #15 | Exceptional 55.4% |
| Soviet Union | 100.0 /100 | #16 | Exceptional 55.1% |
| Eastern Europeans | 100.0 /100 | #17 | Exceptional 55.0% |
| Indians (Asian) | 100.0 /100 | #18 | Exceptional 54.8% |
| Immigrants | Ireland | 100.0 /100 | #19 | Exceptional 54.7% |
| Cambodians | 100.0 /100 | #20 | Exceptional 54.6% |
| Immigrants | Sweden | 100.0 /100 | #21 | Exceptional 54.6% |
| Immigrants | Japan | 100.0 /100 | #22 | Exceptional 54.6% |
| Burmese | 100.0 /100 | #23 | Exceptional 54.6% |
| Immigrants | Korea | 100.0 /100 | #24 | Exceptional 54.5% |
| Immigrants | Switzerland | 100.0 /100 | #25 | Exceptional 54.5% |
| Immigrants | Belgium | 100.0 /100 | #26 | Exceptional 54.5% |
| Latvians | 100.0 /100 | #27 | Exceptional 53.9% |
| Turks | 100.0 /100 | #28 | Exceptional 53.9% |
Demographics Similar to Jordanians by Associate's Degree
In terms of associate's degree, the demographic groups most similar to Jordanians are Syrian (49.3%, a difference of 0.060%), Immigrants from Italy (49.3%, a difference of 0.090%), Croatian (49.3%, a difference of 0.10%), Immigrants from Morocco (49.2%, a difference of 0.13%), and Venezuelan (49.4%, a difference of 0.24%).
| Demographics | Rating | Rank | Associate's Degree |
| Northern Europeans | 97.3 /100 | #101 | Exceptional 49.5% |
| Chileans | 97.3 /100 | #102 | Exceptional 49.4% |
| Ukrainians | 97.1 /100 | #103 | Exceptional 49.4% |
| Venezuelans | 97.0 /100 | #104 | Exceptional 49.4% |
| Croatians | 96.8 /100 | #105 | Exceptional 49.3% |
| Immigrants | Italy | 96.7 /100 | #106 | Exceptional 49.3% |
| Syrians | 96.7 /100 | #107 | Exceptional 49.3% |
| Jordanians | 96.6 /100 | #108 | Exceptional 49.2% |
| Immigrants | Morocco | 96.3 /100 | #109 | Exceptional 49.2% |
| Austrians | 95.8 /100 | #110 | Exceptional 49.1% |
| Immigrants | Venezuela | 95.8 /100 | #111 | Exceptional 49.1% |
| Immigrants | Chile | 95.3 /100 | #112 | Exceptional 49.0% |
| Palestinians | 95.3 /100 | #113 | Exceptional 49.0% |
| Arabs | 95.3 /100 | #114 | Exceptional 49.0% |
| Luxembourgers | 95.1 /100 | #115 | Exceptional 48.9% |