Immigrants from Sweden vs Israeli Associate's Degree

COMPARE

Immigrants from Sweden
Race
Ancestry
AfghanAfricanAlaska NativeAlaskan AthabascanAlbanianAleutAlsatianAmericanApacheArabArapahoArgentineanArmenianAssyrian/Chaldean/SyriacAustralianAustrianBahamianBangladeshiBarbadianBasqueBelgianBelizeanBermudanBhutaneseBlackfeetBolivianBrazilianBritishBritish West IndianBulgarianBurmeseCajunCambodianCanadianCape VerdeanCarpatho RusynCelticCentral AmericanCentral American IndianCherokeeCheyenneChickasawChileanChineseChippewaChoctawColombianColvilleComancheCosta RicanCreeCreekCroatianCrowCubanCypriotCzechCzechoslovakianDanishDelawareDominicanDutchDutch West IndianEastern EuropeanEcuadorianEgyptianEnglishEstonianEthiopianEuropeanFijianFilipinoFinnishFrenchFrench American IndianFrench CanadianGermanGerman RussianGhanaianGreekGuamanian/ChamorroGuatemalanGuyaneseHaitianHmongHonduranHopiHoumaHungarianIcelanderIndian (Asian)IndonesianInupiatIranianIraqiIrishIroquoisItalianJamaicanJapaneseJordanianKenyanKiowaKoreanLaotianLatvianLebaneseLiberianLithuanianLumbeeLuxembourgerMacedonianMalaysianMalteseMarshalleseMenomineeMexicanMexican American IndianMongolianMoroccanNative HawaiianNavajoNepaleseNew ZealanderNicaraguanNigerianNorthern EuropeanNorwegianOkinawanOsageOttawaPaiutePakistaniPalestinianPanamanianParaguayanPennsylvania GermanPeruvianPimaPolishPortuguesePotawatomiPuebloPuerto RicanPuget Sound SalishRomanianRussianSalvadoranSamoanScandinavianScotch-IrishScottishSeminoleSenegaleseSerbianShoshoneSierra LeoneanSiouxSlavicSlovakSloveneSomaliSouth AfricanSouth AmericanSouth American IndianSoviet UnionSpaniardSpanishSpanish AmericanSpanish American IndianSri LankanSubsaharan AfricanSudaneseSwedishSwissSyrianTaiwaneseThaiTlingit-HaidaTohono O'OdhamTonganTrinidadian and TobagonianTsimshianTurkishU.S. Virgin IslanderUgandanUkrainianUruguayanUteVenezuelanVietnameseWelshWest IndianYakamaYaquiYugoslavianYumanYup'ikZimbabwean
Immigration
NonimmigrantsImmigrantsAfghanistanAfricaAlbaniaArgentinaArmeniaAsiaAustraliaAustriaBahamasBangladeshBarbadosBelarusBelgiumBelizeBoliviaBosnia and HerzegovinaBrazilBulgariaBurma/MyanmarCabo VerdeCambodiaCameroonCanadaCaribbeanCentral AmericaChileChinaColombiaCongoCosta RicaCroatiaCubaCzechoslovakiaDenmarkDominicaDominican RepublicEastern AfricaEastern AsiaEastern EuropeEcuadorEgyptEl SalvadorEnglandEritreaEthiopiaEuropeFijiFranceGermanyGhanaGreeceGrenadaGuatemalaGuyanaHaitiHondurasHong KongHungaryIndiaIndonesiaIranIraqIrelandIsraelItalyJamaicaJapanJordanKazakhstanKenyaKoreaKuwaitLaosLatin AmericaLatviaLebanonLiberiaLithuaniaMalaysiaMexicoMicronesiaMiddle AfricaMoldovaMoroccoNepalNetherlandsNicaraguaNigeriaNorth AmericaNorth MacedoniaNorthern AfricaNorthern EuropeNorwayOceaniaPakistanPanamaPeruPhilippinesPolandPortugalRomaniaRussiaSaudi ArabiaScotlandSenegalSerbiaSierra LeoneSingaporeSomaliaSouth AfricaSouth AmericaSouth Central AsiaSouth Eastern AsiaSouthern EuropeSpainSri LankaSt. Vincent and the GrenadinesSudanSwedenSwitzerlandSyriaTaiwanThailandTrinidad and TobagoTurkeyUgandaUkraineUruguayUzbekistanVenezuelaVietnamWest IndiesWestern AfricaWestern AsiaWestern EuropeYemenZaireZimbabweAzores
Israeli
Race
Ancestry
AfghanAfricanAlaska NativeAlaskan AthabascanAlbanianAleutAlsatianAmericanApacheArabArapahoArgentineanArmenianAssyrian/Chaldean/SyriacAustralianAustrianBahamianBangladeshiBarbadianBasqueBelgianBelizeanBermudanBhutaneseBlackfeetBolivianBrazilianBritishBritish West IndianBulgarianBurmeseCajunCambodianCanadianCape VerdeanCarpatho RusynCelticCentral AmericanCentral American IndianCherokeeCheyenneChickasawChileanChineseChippewaChoctawColombianColvilleComancheCosta RicanCreeCreekCroatianCrowCubanCypriotCzechCzechoslovakianDanishDelawareDominicanDutchDutch West IndianEastern EuropeanEcuadorianEgyptianEnglishEstonianEthiopianEuropeanFijianFilipinoFinnishFrenchFrench American IndianFrench CanadianGermanGerman RussianGhanaianGreekGuamanian/ChamorroGuatemalanGuyaneseHaitianHmongHonduranHopiHoumaHungarianIcelanderIndian (Asian)IndonesianInupiatIranianIraqiIrishIroquoisIsraeliItalianJamaicanJapaneseJordanianKenyanKiowaKoreanLaotianLatvianLebaneseLiberianLithuanianLumbeeLuxembourgerMacedonianMalaysianMalteseMarshalleseMenomineeMexicanMexican American IndianMongolianMoroccanNative HawaiianNavajoNepaleseNew ZealanderNicaraguanNigerianNorthern EuropeanNorwegianOkinawanOsageOttawaPaiutePakistaniPalestinianPanamanianParaguayanPennsylvania GermanPeruvianPimaPolishPortuguesePotawatomiPuebloPuerto RicanPuget Sound SalishRomanianRussianSalvadoranSamoanScandinavianScotch-IrishScottishSeminoleSenegaleseSerbianShoshoneSierra LeoneanSiouxSlavicSlovakSloveneSomaliSouth AfricanSouth AmericanSouth American IndianSoviet UnionSpaniardSpanishSpanish AmericanSpanish American IndianSri LankanSubsaharan AfricanSudaneseSwedishSwissSyrianTaiwaneseThaiTlingit-HaidaTohono O'OdhamTonganTrinidadian and TobagonianTsimshianTurkishU.S. Virgin IslanderUgandanUkrainianUruguayanUteVenezuelanVietnameseWelshWest IndianYakamaYaquiYugoslavianYumanYup'ikZimbabwean
Immigration
NonimmigrantsImmigrantsAfghanistanAfricaAlbaniaArgentinaArmeniaAsiaAustraliaAustriaBahamasBangladeshBarbadosBelarusBelgiumBelizeBoliviaBosnia and HerzegovinaBrazilBulgariaBurma/MyanmarCabo VerdeCambodiaCameroonCanadaCaribbeanCentral AmericaChileChinaColombiaCongoCosta RicaCroatiaCubaCzechoslovakiaDenmarkDominicaDominican RepublicEastern AfricaEastern AsiaEastern EuropeEcuadorEgyptEl SalvadorEnglandEritreaEthiopiaEuropeFijiFranceGermanyGhanaGreeceGrenadaGuatemalaGuyanaHaitiHondurasHong KongHungaryIndiaIndonesiaIranIraqIrelandIsraelItalyJamaicaJapanJordanKazakhstanKenyaKoreaKuwaitLaosLatin AmericaLatviaLebanonLiberiaLithuaniaMalaysiaMexicoMicronesiaMiddle AfricaMoldovaMoroccoNepalNetherlandsNicaraguaNigeriaNorth AmericaNorth MacedoniaNorthern AfricaNorthern EuropeNorwayOceaniaPakistanPanamaPeruPhilippinesPolandPortugalRomaniaRussiaSaudi ArabiaScotlandSenegalSerbiaSierra LeoneSingaporeSomaliaSouth AfricaSouth AmericaSouth Central AsiaSouth Eastern AsiaSouthern EuropeSpainSri LankaSt. Vincent and the GrenadinesSudanSwitzerlandSyriaTaiwanThailandTrinidad and TobagoTurkeyUgandaUkraineUruguayUzbekistanVenezuelaVietnamWest IndiesWestern AfricaWestern AsiaWestern EuropeYemenZaireZimbabweAzores
Associate's Degree
Income
Poverty
Unemployment
Labor Participation
Family Structure
Vehicle Availability
Education Level
Disability

Associate's Degree Comparison

Immigrants from Sweden

Israelis

Exceptional
Exceptional
54.6%
ASSOCIATE'S DEGREE
100.0/ 100
METRIC RATING
21st/ 347
METRIC RANK
53.4%
ASSOCIATE'S DEGREE
100.0/ 100
METRIC RATING
33rd/ 347
METRIC RANK

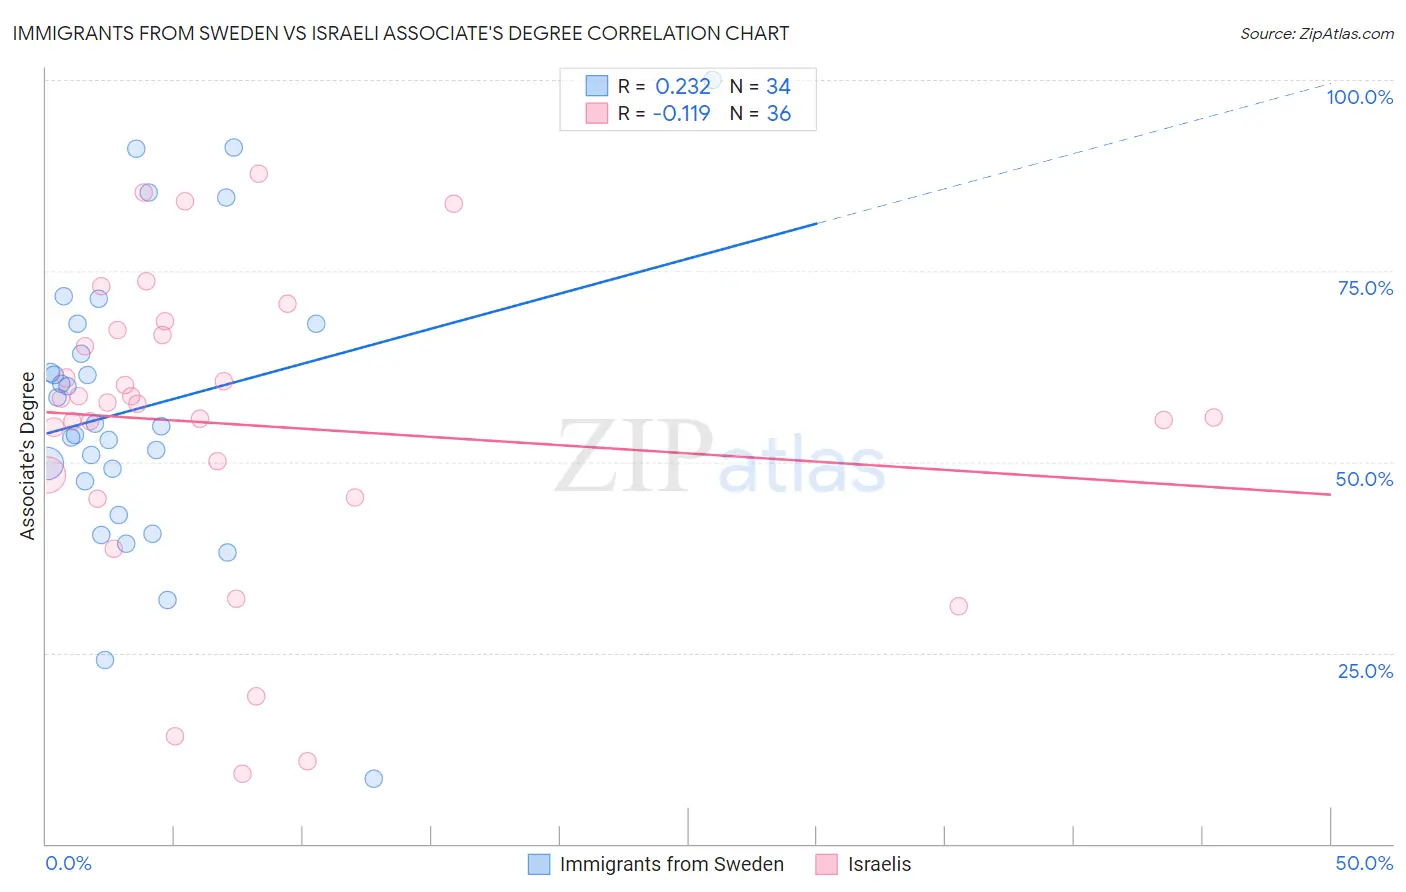
Immigrants from Sweden vs Israeli Associate's Degree Correlation Chart

The statistical analysis conducted on geographies consisting of 164,727,727 people shows a weak positive correlation between the proportion of Immigrants from Sweden and percentage of population with at least associate's degree education in the United States with a correlation coefficient (R) of 0.232 and weighted average of 54.6%. Similarly, the statistical analysis conducted on geographies consisting of 211,190,630 people shows a poor negative correlation between the proportion of Israelis and percentage of population with at least associate's degree education in the United States with a correlation coefficient (R) of -0.119 and weighted average of 53.4%, a difference of 2.3%.
Immigrants from Sweden vs Israeli Associate's Degree

Associate's Degree Correlation Summary

MeasurementImmigrants from SwedenIsraeli
Minimum8.6%9.1%
Maximum100.0%87.7%
Range91.4%78.6%
Mean57.1%54.8%
Median54.8%57.7%
Interquartile 25% (IQ1)47.4%46.9%
Interquartile 75% (IQ3)68.1%66.9%
Interquartile Range (IQR)20.7%20.0%
Standard Deviation (Sample)19.3%19.9%
Standard Deviation (Population)19.0%19.7%

Demographics Similar to Immigrants from Sweden and Israelis by Associate's Degree

In terms of associate's degree, the demographic groups most similar to Immigrants from Sweden are Immigrants from Japan (54.6%, a difference of 0.030%), Burmese (54.6%, a difference of 0.030%), Cambodian (54.6%, a difference of 0.060%), Immigrants from Ireland (54.7%, a difference of 0.090%), and Immigrants from Korea (54.5%, a difference of 0.12%). Similarly, the demographic groups most similar to Israelis are Immigrants from Turkey (53.4%, a difference of 0.12%), Immigrants from Northern Europe (53.5%, a difference of 0.15%), Bulgarian (53.3%, a difference of 0.19%), Russian (53.2%, a difference of 0.26%), and Immigrants from Sri Lanka (53.7%, a difference of 0.51%).
DemographicsRating | RankAssociate's Degree
Eastern Europeans
100.0
/100
|
#17
Exceptional
55.0%
Indians (Asian)
100.0
/100
|
#18
Exceptional
54.8%
Immigrants | Ireland
100.0
/100
|
#19
Exceptional
54.7%
Cambodians
100.0
/100
|
#20
Exceptional
54.6%
Immigrants | Sweden
100.0
/100
|
#21
Exceptional
54.6%
Immigrants | Japan
100.0
/100
|
#22
Exceptional
54.6%
Burmese
100.0
/100
|
#23
Exceptional
54.6%
Immigrants | Korea
100.0
/100
|
#24
Exceptional
54.5%
Immigrants | Switzerland
100.0
/100
|
#25
Exceptional
54.5%
Immigrants | Belgium
100.0
/100
|
#26
Exceptional
54.5%
Latvians
100.0
/100
|
#27
Exceptional
53.9%
Turks
100.0
/100
|
#28
Exceptional
53.9%
Immigrants | France
100.0
/100
|
#29
Exceptional
53.9%
Immigrants | Sri Lanka
100.0
/100
|
#30
Exceptional
53.7%
Immigrants | Northern Europe
100.0
/100
|
#31
Exceptional
53.5%
Immigrants | Turkey
100.0
/100
|
#32
Exceptional
53.4%
Israelis
100.0
/100
|
#33
Exceptional
53.4%
Bulgarians
100.0
/100
|
#34
Exceptional
53.3%
Russians
100.0
/100
|
#35
Exceptional
53.2%
Immigrants | Russia
100.0
/100
|
#36
Exceptional
53.1%
Immigrants | Denmark
100.0
/100
|
#37
Exceptional
53.1%