Immigrants from Sweden vs Guatemalan Associate's Degree
COMPARE
Immigrants from Sweden
Guatemalan
Associate's Degree
Associate's Degree Comparison
Immigrants from Sweden
Guatemalans
54.6%
ASSOCIATE'S DEGREE
100.0/ 100
METRIC RATING
21st/ 347
METRIC RANK
38.5%
ASSOCIATE'S DEGREE
0.0/ 100
METRIC RATING
303rd/ 347
METRIC RANK
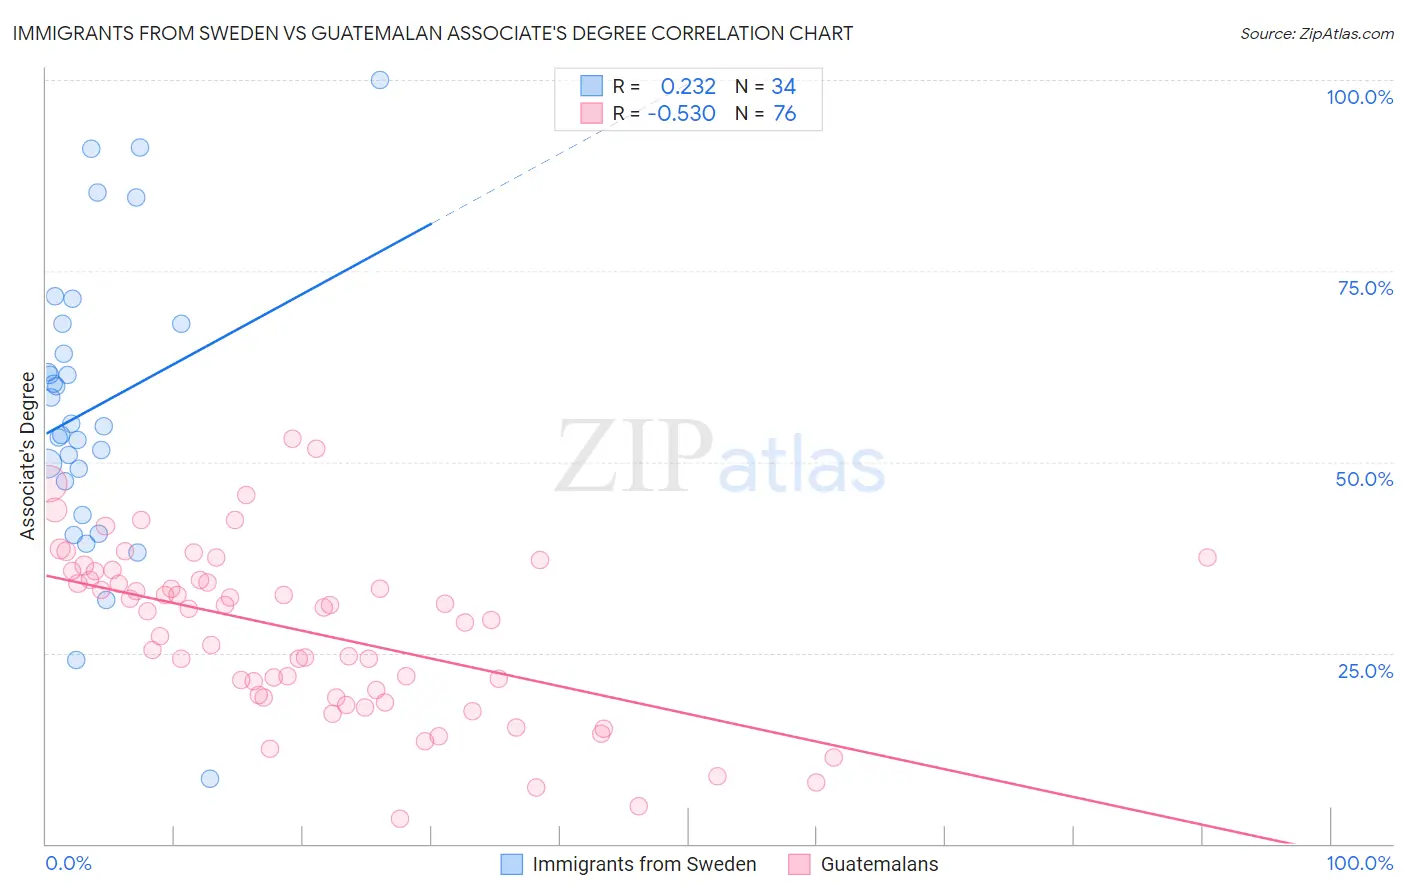
Immigrants from Sweden vs Guatemalan Associate's Degree Correlation Chart
The statistical analysis conducted on geographies consisting of 164,727,727 people shows a weak positive correlation between the proportion of Immigrants from Sweden and percentage of population with at least associate's degree education in the United States with a correlation coefficient (R) of 0.232 and weighted average of 54.6%. Similarly, the statistical analysis conducted on geographies consisting of 409,533,584 people shows a substantial negative correlation between the proportion of Guatemalans and percentage of population with at least associate's degree education in the United States with a correlation coefficient (R) of -0.530 and weighted average of 38.5%, a difference of 41.9%.
Associate's Degree Correlation Summary
| Measurement | Immigrants from Sweden | Guatemalan |
| Minimum | 8.6% | 3.3% |
| Maximum | 100.0% | 53.1% |
| Range | 91.4% | 49.8% |
| Mean | 57.1% | 27.8% |
| Median | 54.8% | 30.6% |
| Interquartile 25% (IQ1) | 47.4% | 19.3% |
| Interquartile 75% (IQ3) | 68.1% | 35.1% |
| Interquartile Range (IQR) | 20.7% | 15.8% |
| Standard Deviation (Sample) | 19.3% | 11.0% |
| Standard Deviation (Population) | 19.0% | 10.9% |
Similar Demographics by Associate's Degree
Demographics Similar to Immigrants from Sweden by Associate's Degree
In terms of associate's degree, the demographic groups most similar to Immigrants from Sweden are Immigrants from Japan (54.6%, a difference of 0.030%), Burmese (54.6%, a difference of 0.030%), Cambodian (54.6%, a difference of 0.060%), Immigrants from Ireland (54.7%, a difference of 0.090%), and Immigrants from Korea (54.5%, a difference of 0.12%).
| Demographics | Rating | Rank | Associate's Degree |
| Immigrants | Hong Kong | 100.0 /100 | #14 | Exceptional 55.4% |
| Immigrants | Eastern Asia | 100.0 /100 | #15 | Exceptional 55.4% |
| Soviet Union | 100.0 /100 | #16 | Exceptional 55.1% |
| Eastern Europeans | 100.0 /100 | #17 | Exceptional 55.0% |
| Indians (Asian) | 100.0 /100 | #18 | Exceptional 54.8% |
| Immigrants | Ireland | 100.0 /100 | #19 | Exceptional 54.7% |
| Cambodians | 100.0 /100 | #20 | Exceptional 54.6% |
| Immigrants | Sweden | 100.0 /100 | #21 | Exceptional 54.6% |
| Immigrants | Japan | 100.0 /100 | #22 | Exceptional 54.6% |
| Burmese | 100.0 /100 | #23 | Exceptional 54.6% |
| Immigrants | Korea | 100.0 /100 | #24 | Exceptional 54.5% |
| Immigrants | Switzerland | 100.0 /100 | #25 | Exceptional 54.5% |
| Immigrants | Belgium | 100.0 /100 | #26 | Exceptional 54.5% |
| Latvians | 100.0 /100 | #27 | Exceptional 53.9% |
| Turks | 100.0 /100 | #28 | Exceptional 53.9% |
Demographics Similar to Guatemalans by Associate's Degree
In terms of associate's degree, the demographic groups most similar to Guatemalans are Sioux (38.5%, a difference of 0.050%), Colville (38.5%, a difference of 0.090%), Immigrants from Honduras (38.5%, a difference of 0.12%), Shoshone (38.4%, a difference of 0.19%), and Immigrants from El Salvador (38.4%, a difference of 0.23%).
| Demographics | Rating | Rank | Associate's Degree |
| Cherokee | 0.0 /100 | #296 | Tragic 38.9% |
| Cape Verdeans | 0.0 /100 | #297 | Tragic 38.8% |
| Cheyenne | 0.0 /100 | #298 | Tragic 38.7% |
| Ute | 0.0 /100 | #299 | Tragic 38.6% |
| Chickasaw | 0.0 /100 | #300 | Tragic 38.6% |
| Tsimshian | 0.0 /100 | #301 | Tragic 38.6% |
| Colville | 0.0 /100 | #302 | Tragic 38.5% |
| Guatemalans | 0.0 /100 | #303 | Tragic 38.5% |
| Sioux | 0.0 /100 | #304 | Tragic 38.5% |
| Immigrants | Honduras | 0.0 /100 | #305 | Tragic 38.5% |
| Shoshone | 0.0 /100 | #306 | Tragic 38.4% |
| Immigrants | El Salvador | 0.0 /100 | #307 | Tragic 38.4% |
| Mexican American Indians | 0.0 /100 | #308 | Tragic 38.2% |
| Immigrants | Guatemala | 0.0 /100 | #309 | Tragic 38.1% |
| Immigrants | Dominican Republic | 0.0 /100 | #310 | Tragic 37.9% |