Immigrants from Indonesia vs Jordanian Associate's Degree
COMPARE
Immigrants from Indonesia
Jordanian
Associate's Degree
Associate's Degree Comparison
Immigrants from Indonesia
Jordanians
51.0%
ASSOCIATE'S DEGREE
99.5/ 100
METRIC RATING
68th/ 347
METRIC RANK
49.2%
ASSOCIATE'S DEGREE
96.6/ 100
METRIC RATING
108th/ 347
METRIC RANK
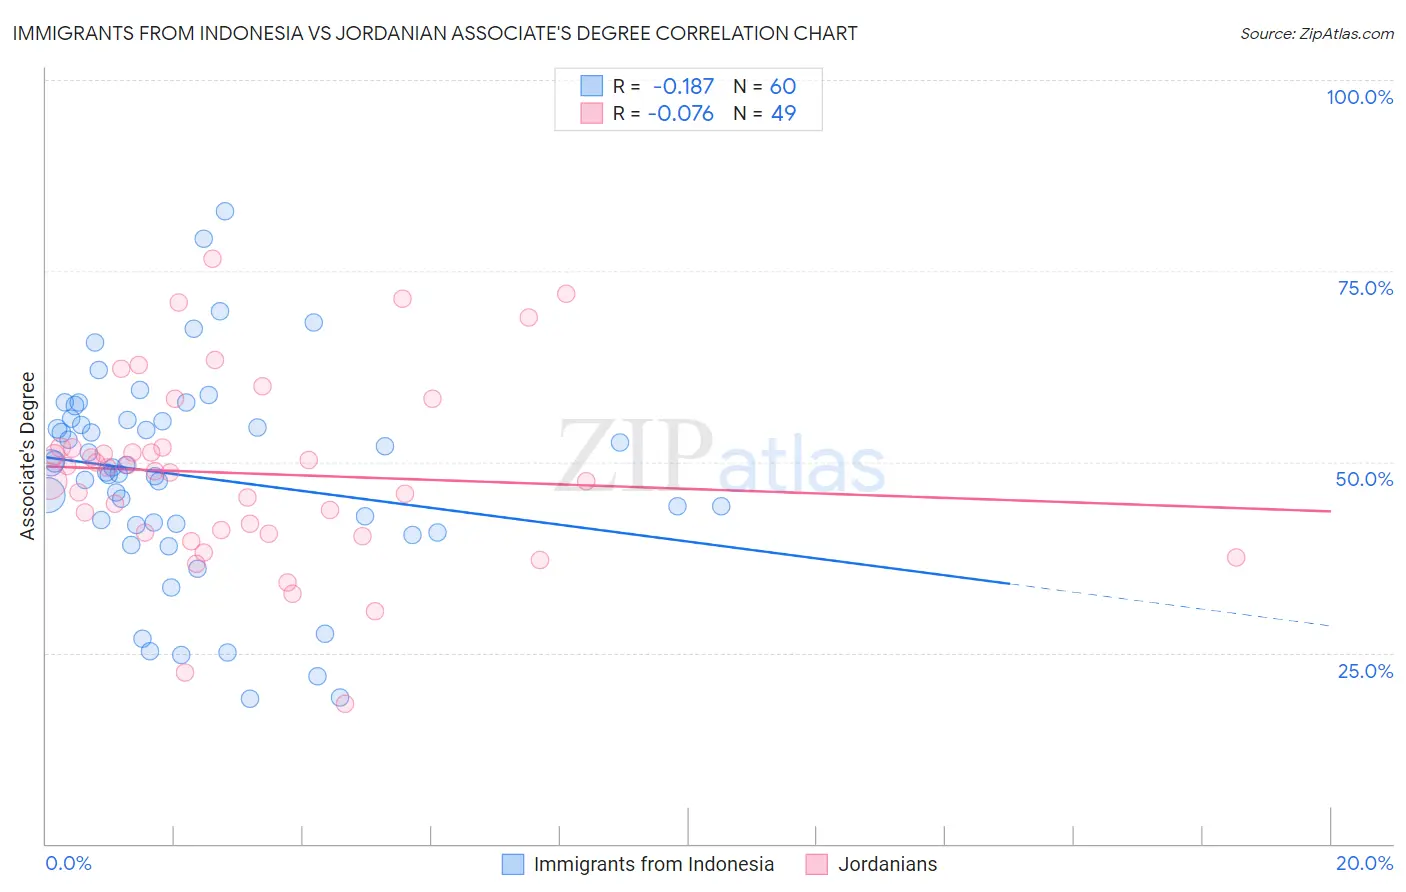
Immigrants from Indonesia vs Jordanian Associate's Degree Correlation Chart
The statistical analysis conducted on geographies consisting of 215,779,806 people shows a poor negative correlation between the proportion of Immigrants from Indonesia and percentage of population with at least associate's degree education in the United States with a correlation coefficient (R) of -0.187 and weighted average of 51.0%. Similarly, the statistical analysis conducted on geographies consisting of 166,424,117 people shows a slight negative correlation between the proportion of Jordanians and percentage of population with at least associate's degree education in the United States with a correlation coefficient (R) of -0.076 and weighted average of 49.2%, a difference of 3.5%.
Associate's Degree Correlation Summary
| Measurement | Immigrants from Indonesia | Jordanian |
| Minimum | 19.0% | 18.4% |
| Maximum | 82.8% | 76.6% |
| Range | 63.7% | 58.2% |
| Mean | 48.1% | 48.5% |
| Median | 49.0% | 48.8% |
| Interquartile 25% (IQ1) | 41.9% | 40.7% |
| Interquartile 75% (IQ3) | 55.4% | 51.9% |
| Interquartile Range (IQR) | 13.5% | 11.1% |
| Standard Deviation (Sample) | 13.5% | 12.2% |
| Standard Deviation (Population) | 13.3% | 12.0% |
Similar Demographics by Associate's Degree
Demographics Similar to Immigrants from Indonesia by Associate's Degree
In terms of associate's degree, the demographic groups most similar to Immigrants from Indonesia are Egyptian (50.9%, a difference of 0.12%), Immigrants from Argentina (50.9%, a difference of 0.15%), Immigrants from Romania (50.9%, a difference of 0.16%), Immigrants from Pakistan (50.9%, a difference of 0.22%), and Argentinean (51.2%, a difference of 0.49%).
| Demographics | Rating | Rank | Associate's Degree |
| Immigrants | Kazakhstan | 99.7 /100 | #61 | Exceptional 51.4% |
| Bhutanese | 99.7 /100 | #62 | Exceptional 51.4% |
| South Africans | 99.7 /100 | #63 | Exceptional 51.4% |
| Immigrants | Netherlands | 99.7 /100 | #64 | Exceptional 51.4% |
| Zimbabweans | 99.7 /100 | #65 | Exceptional 51.3% |
| Immigrants | Europe | 99.7 /100 | #66 | Exceptional 51.3% |
| Argentineans | 99.6 /100 | #67 | Exceptional 51.2% |
| Immigrants | Indonesia | 99.5 /100 | #68 | Exceptional 51.0% |
| Egyptians | 99.5 /100 | #69 | Exceptional 50.9% |
| Immigrants | Argentina | 99.5 /100 | #70 | Exceptional 50.9% |
| Immigrants | Romania | 99.5 /100 | #71 | Exceptional 50.9% |
| Immigrants | Pakistan | 99.5 /100 | #72 | Exceptional 50.9% |
| Carpatho Rusyns | 99.3 /100 | #73 | Exceptional 50.6% |
| Lithuanians | 99.3 /100 | #74 | Exceptional 50.6% |
| Immigrants | Scotland | 99.3 /100 | #75 | Exceptional 50.6% |
Demographics Similar to Jordanians by Associate's Degree
In terms of associate's degree, the demographic groups most similar to Jordanians are Syrian (49.3%, a difference of 0.060%), Immigrants from Italy (49.3%, a difference of 0.090%), Croatian (49.3%, a difference of 0.10%), Immigrants from Morocco (49.2%, a difference of 0.13%), and Venezuelan (49.4%, a difference of 0.24%).
| Demographics | Rating | Rank | Associate's Degree |
| Northern Europeans | 97.3 /100 | #101 | Exceptional 49.5% |
| Chileans | 97.3 /100 | #102 | Exceptional 49.4% |
| Ukrainians | 97.1 /100 | #103 | Exceptional 49.4% |
| Venezuelans | 97.0 /100 | #104 | Exceptional 49.4% |
| Croatians | 96.8 /100 | #105 | Exceptional 49.3% |
| Immigrants | Italy | 96.7 /100 | #106 | Exceptional 49.3% |
| Syrians | 96.7 /100 | #107 | Exceptional 49.3% |
| Jordanians | 96.6 /100 | #108 | Exceptional 49.2% |
| Immigrants | Morocco | 96.3 /100 | #109 | Exceptional 49.2% |
| Austrians | 95.8 /100 | #110 | Exceptional 49.1% |
| Immigrants | Venezuela | 95.8 /100 | #111 | Exceptional 49.1% |
| Immigrants | Chile | 95.3 /100 | #112 | Exceptional 49.0% |
| Palestinians | 95.3 /100 | #113 | Exceptional 49.0% |
| Arabs | 95.3 /100 | #114 | Exceptional 49.0% |
| Luxembourgers | 95.1 /100 | #115 | Exceptional 48.9% |