Immigrants from Panama vs Jordanian Associate's Degree
COMPARE
Immigrants from Panama
Jordanian
Associate's Degree
Associate's Degree Comparison
Immigrants from Panama
Jordanians
44.7%
ASSOCIATE'S DEGREE
12.4/ 100
METRIC RATING
215th/ 347
METRIC RANK
49.2%
ASSOCIATE'S DEGREE
96.6/ 100
METRIC RATING
108th/ 347
METRIC RANK
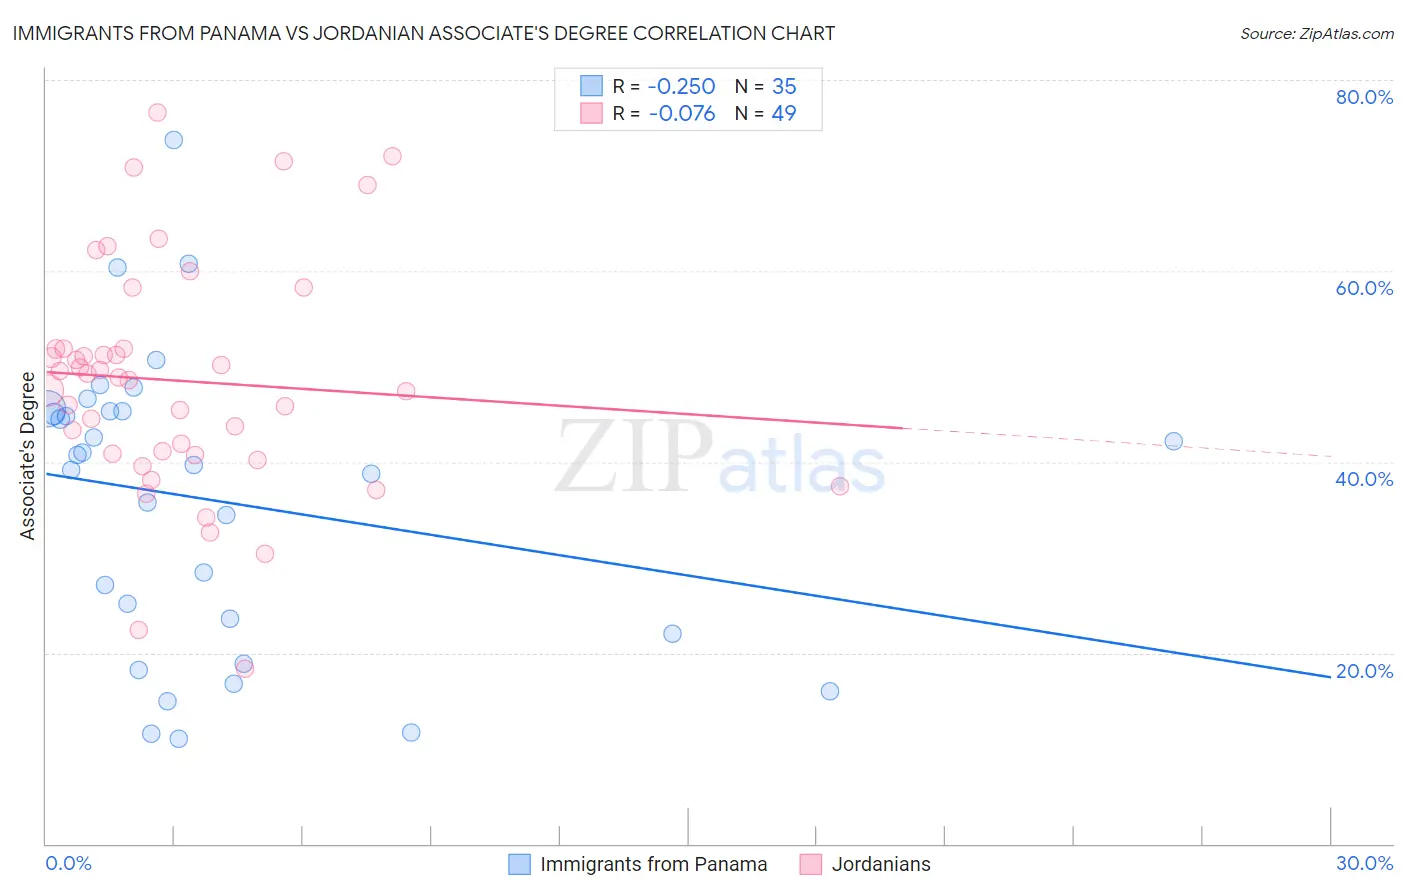
Immigrants from Panama vs Jordanian Associate's Degree Correlation Chart
The statistical analysis conducted on geographies consisting of 221,180,588 people shows a weak negative correlation between the proportion of Immigrants from Panama and percentage of population with at least associate's degree education in the United States with a correlation coefficient (R) of -0.250 and weighted average of 44.7%. Similarly, the statistical analysis conducted on geographies consisting of 166,424,117 people shows a slight negative correlation between the proportion of Jordanians and percentage of population with at least associate's degree education in the United States with a correlation coefficient (R) of -0.076 and weighted average of 49.2%, a difference of 10.3%.
Associate's Degree Correlation Summary
| Measurement | Immigrants from Panama | Jordanian |
| Minimum | 11.1% | 18.4% |
| Maximum | 73.8% | 76.6% |
| Range | 62.7% | 58.2% |
| Mean | 35.9% | 48.5% |
| Median | 39.6% | 48.8% |
| Interquartile 25% (IQ1) | 22.0% | 40.7% |
| Interquartile 75% (IQ3) | 45.4% | 51.9% |
| Interquartile Range (IQR) | 23.4% | 11.1% |
| Standard Deviation (Sample) | 15.5% | 12.2% |
| Standard Deviation (Population) | 15.3% | 12.0% |
Similar Demographics by Associate's Degree
Demographics Similar to Immigrants from Panama by Associate's Degree
In terms of associate's degree, the demographic groups most similar to Immigrants from Panama are Immigrants from Middle Africa (44.7%, a difference of 0.060%), Immigrants from Nigeria (44.6%, a difference of 0.18%), Immigrants from Ghana (44.8%, a difference of 0.31%), Immigrants (44.5%, a difference of 0.37%), and French Canadian (44.9%, a difference of 0.43%).
| Demographics | Rating | Rank | Associate's Degree |
| Dutch | 17.6 /100 | #208 | Poor 45.0% |
| Immigrants | Costa Rica | 16.7 /100 | #209 | Poor 45.0% |
| Immigrants | Philippines | 16.7 /100 | #210 | Poor 45.0% |
| Immigrants | Zaire | 16.6 /100 | #211 | Poor 45.0% |
| French Canadians | 15.0 /100 | #212 | Poor 44.9% |
| Immigrants | Ghana | 14.2 /100 | #213 | Poor 44.8% |
| Immigrants | Middle Africa | 12.7 /100 | #214 | Poor 44.7% |
| Immigrants | Panama | 12.4 /100 | #215 | Poor 44.7% |
| Immigrants | Nigeria | 11.4 /100 | #216 | Poor 44.6% |
| Immigrants | Immigrants | 10.5 /100 | #217 | Poor 44.5% |
| Spanish | 9.4 /100 | #218 | Tragic 44.4% |
| Whites/Caucasians | 7.5 /100 | #219 | Tragic 44.2% |
| Portuguese | 7.2 /100 | #220 | Tragic 44.1% |
| Immigrants | Western Africa | 6.6 /100 | #221 | Tragic 44.1% |
| Barbadians | 5.8 /100 | #222 | Tragic 43.9% |
Demographics Similar to Jordanians by Associate's Degree
In terms of associate's degree, the demographic groups most similar to Jordanians are Syrian (49.3%, a difference of 0.060%), Immigrants from Italy (49.3%, a difference of 0.090%), Croatian (49.3%, a difference of 0.10%), Immigrants from Morocco (49.2%, a difference of 0.13%), and Venezuelan (49.4%, a difference of 0.24%).
| Demographics | Rating | Rank | Associate's Degree |
| Northern Europeans | 97.3 /100 | #101 | Exceptional 49.5% |
| Chileans | 97.3 /100 | #102 | Exceptional 49.4% |
| Ukrainians | 97.1 /100 | #103 | Exceptional 49.4% |
| Venezuelans | 97.0 /100 | #104 | Exceptional 49.4% |
| Croatians | 96.8 /100 | #105 | Exceptional 49.3% |
| Immigrants | Italy | 96.7 /100 | #106 | Exceptional 49.3% |
| Syrians | 96.7 /100 | #107 | Exceptional 49.3% |
| Jordanians | 96.6 /100 | #108 | Exceptional 49.2% |
| Immigrants | Morocco | 96.3 /100 | #109 | Exceptional 49.2% |
| Austrians | 95.8 /100 | #110 | Exceptional 49.1% |
| Immigrants | Venezuela | 95.8 /100 | #111 | Exceptional 49.1% |
| Immigrants | Chile | 95.3 /100 | #112 | Exceptional 49.0% |
| Palestinians | 95.3 /100 | #113 | Exceptional 49.0% |
| Arabs | 95.3 /100 | #114 | Exceptional 49.0% |
| Luxembourgers | 95.1 /100 | #115 | Exceptional 48.9% |