Immigrants from Sweden vs Ethiopian GED/Equivalency
COMPARE
Immigrants from Sweden
Ethiopian
GED/Equivalency
GED/Equivalency Comparison
Immigrants from Sweden
Ethiopians
88.4%
GED/EQUIVALENCY
99.7/ 100
METRIC RATING
33rd/ 347
METRIC RANK
86.0%
GED/EQUIVALENCY
63.7/ 100
METRIC RATING
167th/ 347
METRIC RANK
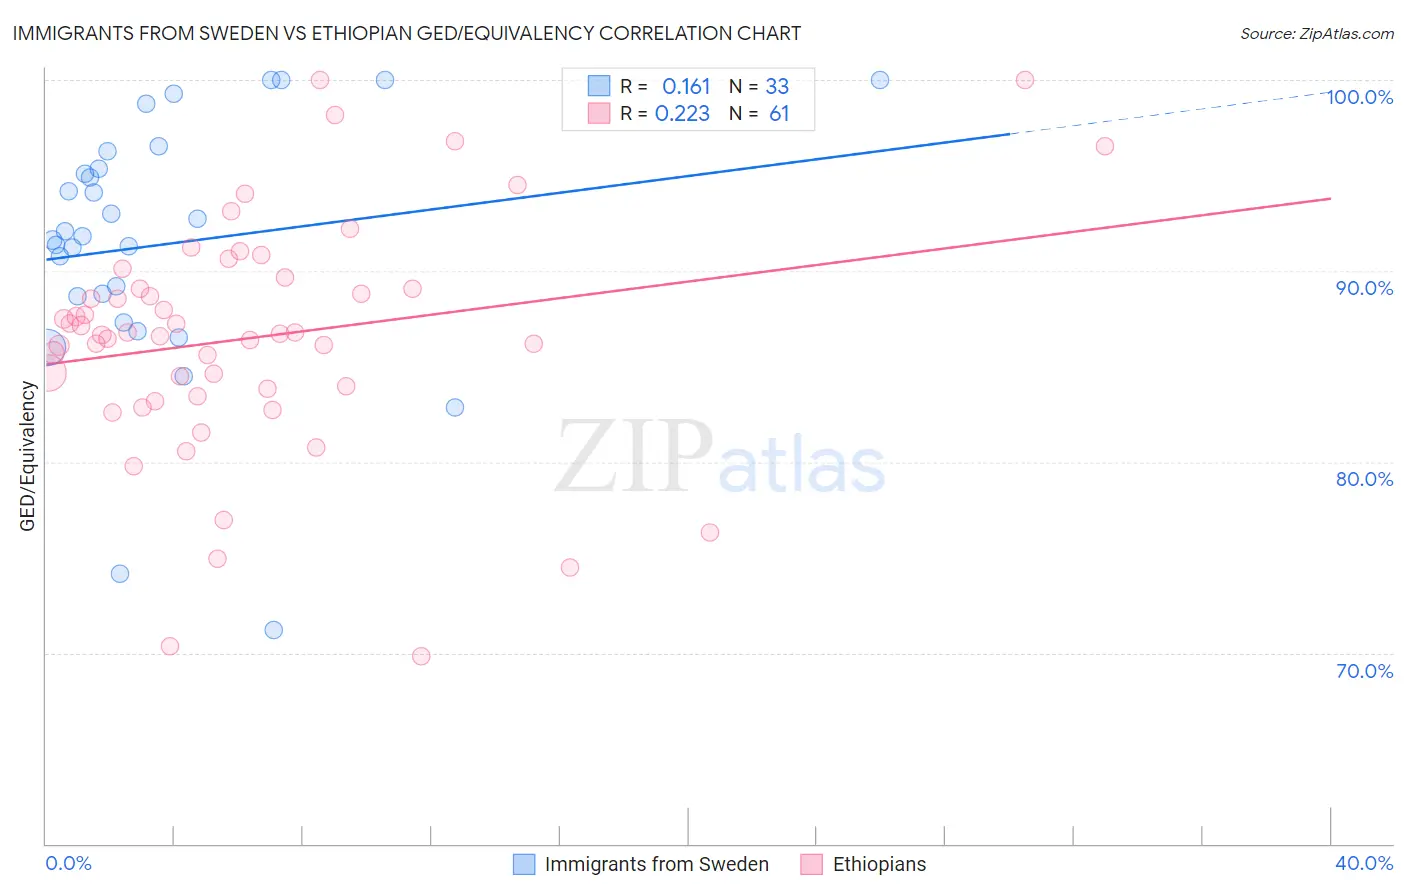
Immigrants from Sweden vs Ethiopian GED/Equivalency Correlation Chart
The statistical analysis conducted on geographies consisting of 164,737,092 people shows a poor positive correlation between the proportion of Immigrants from Sweden and percentage of population with at least ged/equivalency education in the United States with a correlation coefficient (R) of 0.161 and weighted average of 88.4%. Similarly, the statistical analysis conducted on geographies consisting of 223,262,051 people shows a weak positive correlation between the proportion of Ethiopians and percentage of population with at least ged/equivalency education in the United States with a correlation coefficient (R) of 0.223 and weighted average of 86.0%, a difference of 2.8%.
GED/Equivalency Correlation Summary
| Measurement | Immigrants from Sweden | Ethiopian |
| Minimum | 71.2% | 69.8% |
| Maximum | 100.0% | 100.0% |
| Range | 28.8% | 30.2% |
| Mean | 91.4% | 86.5% |
| Median | 91.8% | 86.7% |
| Interquartile 25% (IQ1) | 88.0% | 83.6% |
| Interquartile 75% (IQ3) | 95.8% | 89.4% |
| Interquartile Range (IQR) | 7.8% | 5.7% |
| Standard Deviation (Sample) | 6.8% | 6.2% |
| Standard Deviation (Population) | 6.6% | 6.1% |
Similar Demographics by GED/Equivalency
Demographics Similar to Immigrants from Sweden by GED/Equivalency
In terms of ged/equivalency, the demographic groups most similar to Immigrants from Sweden are Immigrants from Japan (88.4%, a difference of 0.010%), Immigrants from South Central Asia (88.4%, a difference of 0.020%), Danish (88.4%, a difference of 0.040%), Immigrants from Belgium (88.3%, a difference of 0.050%), and Bhutanese (88.4%, a difference of 0.060%).
| Demographics | Rating | Rank | GED/Equivalency |
| Immigrants | Australia | 99.8 /100 | #26 | Exceptional 88.6% |
| Immigrants | Lithuania | 99.8 /100 | #27 | Exceptional 88.6% |
| Immigrants | Northern Europe | 99.8 /100 | #28 | Exceptional 88.5% |
| Poles | 99.8 /100 | #29 | Exceptional 88.5% |
| Turks | 99.8 /100 | #30 | Exceptional 88.5% |
| Bhutanese | 99.8 /100 | #31 | Exceptional 88.4% |
| Danes | 99.8 /100 | #32 | Exceptional 88.4% |
| Immigrants | Sweden | 99.7 /100 | #33 | Exceptional 88.4% |
| Immigrants | Japan | 99.7 /100 | #34 | Exceptional 88.4% |
| Immigrants | South Central Asia | 99.7 /100 | #35 | Exceptional 88.4% |
| Immigrants | Belgium | 99.7 /100 | #36 | Exceptional 88.3% |
| Immigrants | Austria | 99.7 /100 | #37 | Exceptional 88.3% |
| Burmese | 99.7 /100 | #38 | Exceptional 88.3% |
| Immigrants | Israel | 99.6 /100 | #39 | Exceptional 88.2% |
| Italians | 99.6 /100 | #40 | Exceptional 88.2% |
Demographics Similar to Ethiopians by GED/Equivalency
In terms of ged/equivalency, the demographic groups most similar to Ethiopians are Alsatian (86.0%, a difference of 0.010%), Immigrants from Albania (86.0%, a difference of 0.010%), Venezuelan (86.0%, a difference of 0.040%), Sierra Leonean (86.0%, a difference of 0.040%), and Immigrants from Ethiopia (86.0%, a difference of 0.050%).
| Demographics | Rating | Rank | GED/Equivalency |
| Immigrants | Morocco | 69.5 /100 | #160 | Good 86.1% |
| Immigrants | Syria | 69.3 /100 | #161 | Good 86.1% |
| Immigrants | Iraq | 68.1 /100 | #162 | Good 86.1% |
| Ugandans | 66.3 /100 | #163 | Good 86.1% |
| Venezuelans | 65.5 /100 | #164 | Good 86.0% |
| Alsatians | 64.3 /100 | #165 | Good 86.0% |
| Immigrants | Albania | 64.2 /100 | #166 | Good 86.0% |
| Ethiopians | 63.7 /100 | #167 | Good 86.0% |
| Sierra Leoneans | 61.8 /100 | #168 | Good 86.0% |
| Immigrants | Ethiopia | 61.2 /100 | #169 | Good 86.0% |
| Afghans | 59.7 /100 | #170 | Average 85.9% |
| Immigrants | Chile | 57.3 /100 | #171 | Average 85.9% |
| Bermudans | 55.1 /100 | #172 | Average 85.8% |
| Immigrants | Venezuela | 50.7 /100 | #173 | Average 85.8% |
| Ottawa | 50.0 /100 | #174 | Average 85.8% |