Immigrants from Sudan vs Immigrants from Pakistan 8th Grade
COMPARE
Immigrants from Sudan
Immigrants from Pakistan
8th Grade
8th Grade Comparison
Immigrants from Sudan
Immigrants from Pakistan
95.5%
8TH GRADE
15.1/ 100
METRIC RATING
207th/ 347
METRIC RANK
95.4%
8TH GRADE
9.7/ 100
METRIC RATING
212th/ 347
METRIC RANK
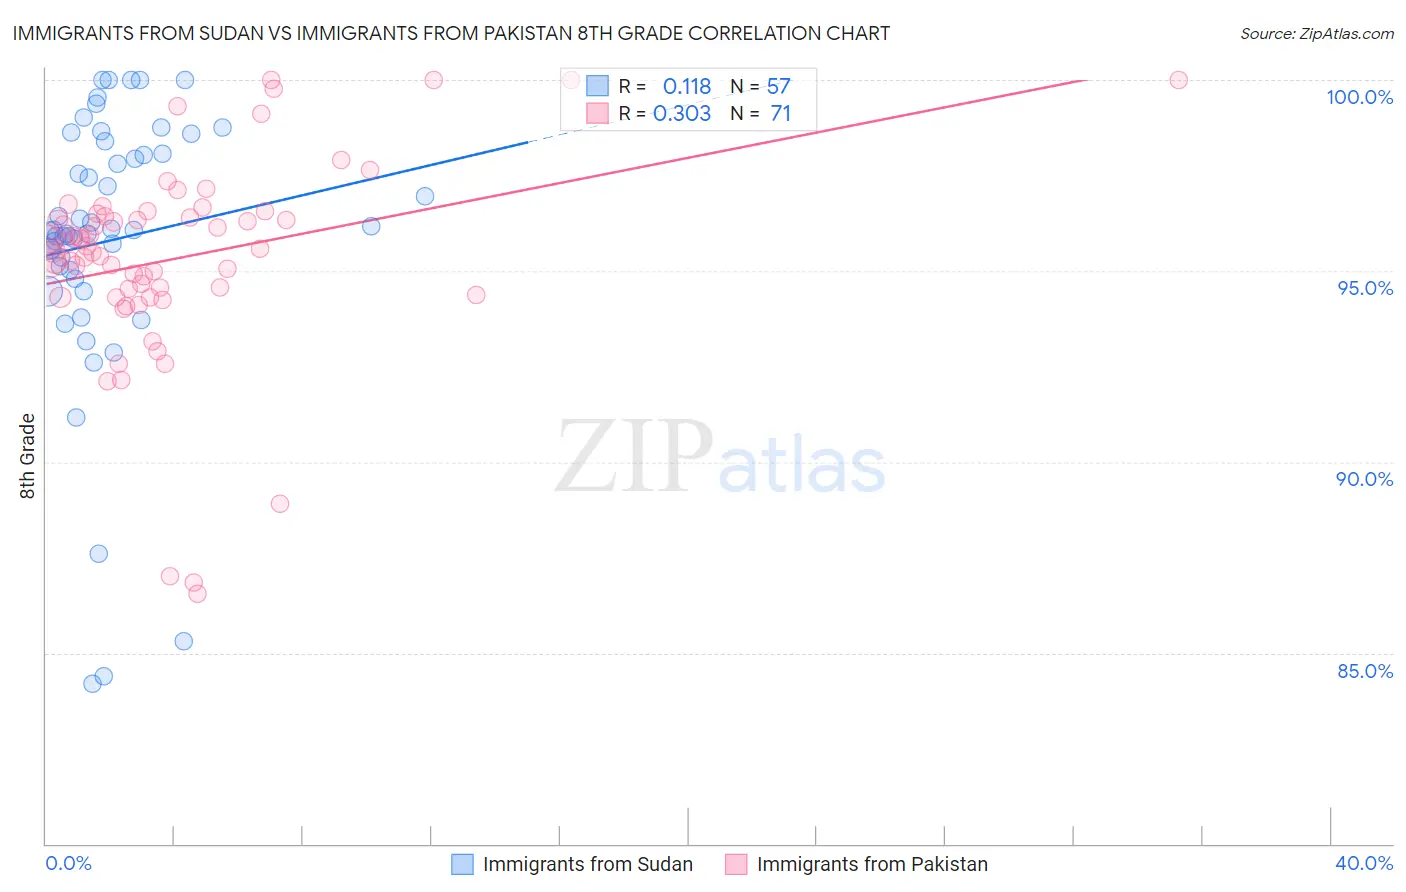
Immigrants from Sudan vs Immigrants from Pakistan 8th Grade Correlation Chart
The statistical analysis conducted on geographies consisting of 118,959,807 people shows a poor positive correlation between the proportion of Immigrants from Sudan and percentage of population with at least 8th grade education in the United States with a correlation coefficient (R) of 0.118 and weighted average of 95.5%. Similarly, the statistical analysis conducted on geographies consisting of 283,836,178 people shows a mild positive correlation between the proportion of Immigrants from Pakistan and percentage of population with at least 8th grade education in the United States with a correlation coefficient (R) of 0.303 and weighted average of 95.4%, a difference of 0.080%.
8th Grade Correlation Summary
| Measurement | Immigrants from Sudan | Immigrants from Pakistan |
| Minimum | 84.2% | 86.5% |
| Maximum | 100.0% | 100.0% |
| Range | 15.8% | 13.5% |
| Mean | 95.8% | 95.3% |
| Median | 96.1% | 95.6% |
| Interquartile 25% (IQ1) | 94.9% | 94.4% |
| Interquartile 75% (IQ3) | 98.2% | 96.5% |
| Interquartile Range (IQR) | 3.3% | 2.1% |
| Standard Deviation (Sample) | 3.6% | 2.7% |
| Standard Deviation (Population) | 3.5% | 2.7% |
Demographics Similar to Immigrants from Sudan and Immigrants from Pakistan by 8th Grade
In terms of 8th grade, the demographic groups most similar to Immigrants from Sudan are Portuguese (95.5%, a difference of 0.010%), Hawaiian (95.5%, a difference of 0.020%), Immigrants from Bahamas (95.5%, a difference of 0.020%), Comanche (95.5%, a difference of 0.020%), and Immigrants from Lebanon (95.4%, a difference of 0.020%). Similarly, the demographic groups most similar to Immigrants from Pakistan are Laotian (95.4%, a difference of 0.010%), Immigrants from Chile (95.4%, a difference of 0.010%), Immigrants from Liberia (95.4%, a difference of 0.010%), Samoan (95.4%, a difference of 0.030%), and Immigrants from Eastern Asia (95.4%, a difference of 0.030%).
| Demographics | Rating | Rank | 8th Grade |
| Immigrants | Northern Africa | 22.5 /100 | #199 | Fair 95.5% |
| Argentineans | 22.2 /100 | #200 | Fair 95.5% |
| Immigrants | Argentina | 20.6 /100 | #201 | Fair 95.5% |
| Apache | 19.4 /100 | #202 | Poor 95.5% |
| Moroccans | 17.4 /100 | #203 | Poor 95.5% |
| Hawaiians | 16.7 /100 | #204 | Poor 95.5% |
| Immigrants | Bahamas | 16.7 /100 | #205 | Poor 95.5% |
| Comanche | 16.3 /100 | #206 | Poor 95.5% |
| Immigrants | Sudan | 15.1 /100 | #207 | Poor 95.5% |
| Portuguese | 14.3 /100 | #208 | Poor 95.5% |
| Immigrants | Lebanon | 13.7 /100 | #209 | Poor 95.4% |
| Africans | 13.6 /100 | #210 | Poor 95.4% |
| Immigrants | Morocco | 12.4 /100 | #211 | Poor 95.4% |
| Immigrants | Pakistan | 9.7 /100 | #212 | Tragic 95.4% |
| Laotians | 9.0 /100 | #213 | Tragic 95.4% |
| Immigrants | Chile | 9.0 /100 | #214 | Tragic 95.4% |
| Immigrants | Liberia | 8.9 /100 | #215 | Tragic 95.4% |
| Samoans | 8.4 /100 | #216 | Tragic 95.4% |
| Immigrants | Eastern Asia | 8.3 /100 | #217 | Tragic 95.4% |
| Dutch West Indians | 8.1 /100 | #218 | Tragic 95.4% |
| Spanish Americans | 8.0 /100 | #219 | Tragic 95.4% |