Immigrants from St. Vincent and the Grenadines vs U.S. Virgin Islander Associate's Degree
COMPARE
Immigrants from St. Vincent and the Grenadines
U.S. Virgin Islander
Associate's Degree
Associate's Degree Comparison
Immigrants from St. Vincent and the Grenadines
U.S. Virgin Islanders
42.9%
ASSOCIATE'S DEGREE
1.9/ 100
METRIC RATING
236th/ 347
METRIC RANK
42.1%
ASSOCIATE'S DEGREE
0.7/ 100
METRIC RATING
250th/ 347
METRIC RANK
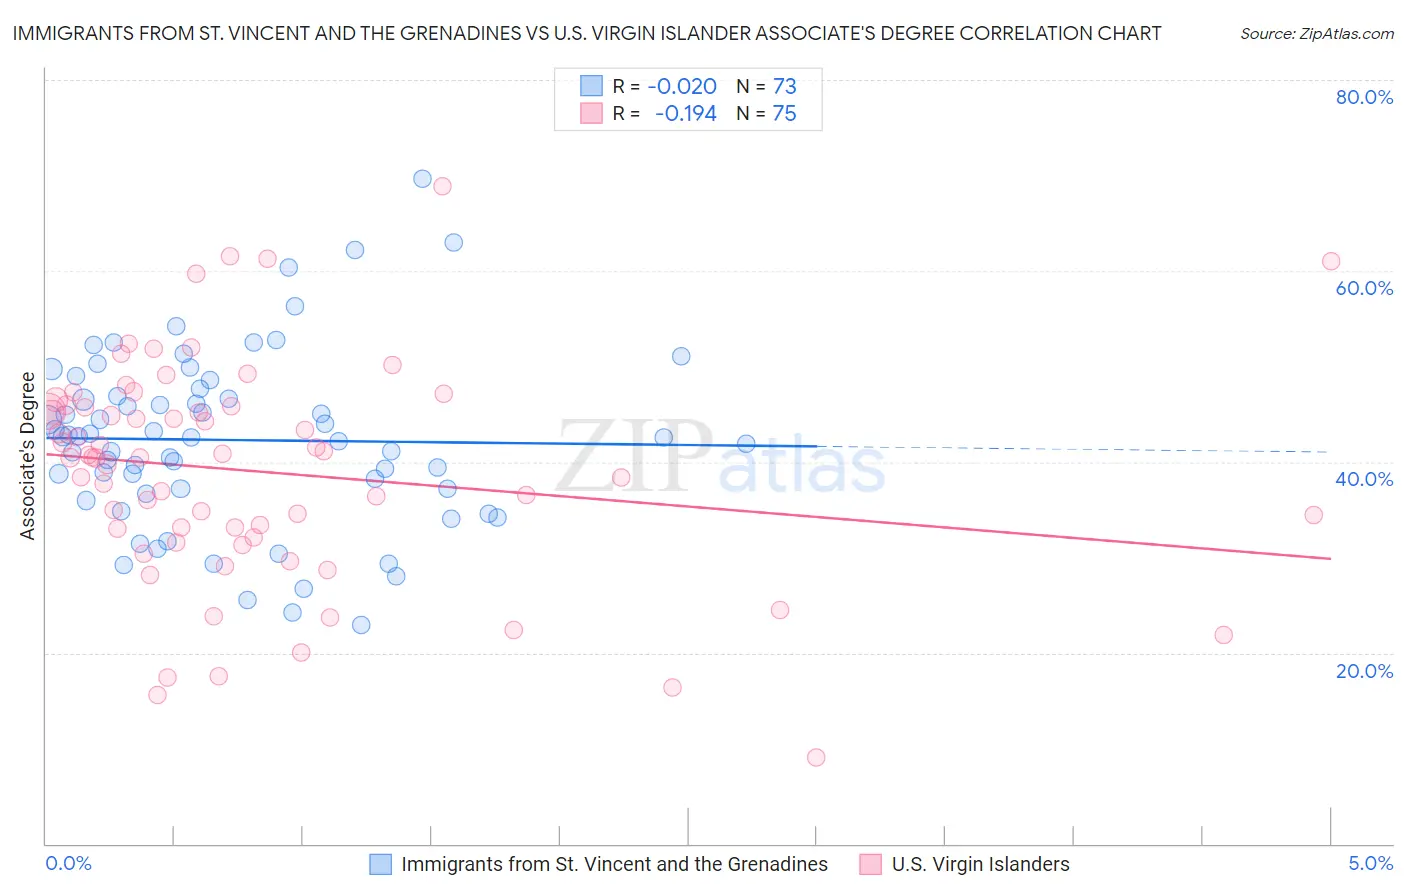
Immigrants from St. Vincent and the Grenadines vs U.S. Virgin Islander Associate's Degree Correlation Chart
The statistical analysis conducted on geographies consisting of 56,191,418 people shows no correlation between the proportion of Immigrants from St. Vincent and the Grenadines and percentage of population with at least associate's degree education in the United States with a correlation coefficient (R) of -0.020 and weighted average of 42.9%. Similarly, the statistical analysis conducted on geographies consisting of 87,527,119 people shows a poor negative correlation between the proportion of U.S. Virgin Islanders and percentage of population with at least associate's degree education in the United States with a correlation coefficient (R) of -0.194 and weighted average of 42.1%, a difference of 1.9%.
Associate's Degree Correlation Summary
| Measurement | Immigrants from St. Vincent and the Grenadines | U.S. Virgin Islander |
| Minimum | 23.0% | 9.0% |
| Maximum | 69.7% | 68.9% |
| Range | 46.7% | 59.9% |
| Mean | 42.3% | 38.9% |
| Median | 42.6% | 40.4% |
| Interquartile 25% (IQ1) | 36.9% | 32.1% |
| Interquartile 75% (IQ3) | 47.3% | 45.9% |
| Interquartile Range (IQR) | 10.4% | 13.8% |
| Standard Deviation (Sample) | 9.2% | 11.6% |
| Standard Deviation (Population) | 9.2% | 11.5% |
Demographics Similar to Immigrants from St. Vincent and the Grenadines and U.S. Virgin Islanders by Associate's Degree
In terms of associate's degree, the demographic groups most similar to Immigrants from St. Vincent and the Grenadines are Nonimmigrants (42.9%, a difference of 0.020%), Ecuadorian (43.0%, a difference of 0.080%), Tlingit-Haida (43.0%, a difference of 0.18%), Tongan (43.0%, a difference of 0.27%), and Iroquois (42.8%, a difference of 0.28%). Similarly, the demographic groups most similar to U.S. Virgin Islanders are Jamaican (42.1%, a difference of 0.010%), Immigrants from Bahamas (42.1%, a difference of 0.020%), Immigrants from Ecuador (42.2%, a difference of 0.16%), Immigrants from Fiji (42.2%, a difference of 0.24%), and Delaware (42.3%, a difference of 0.33%).
| Demographics | Rating | Rank | Associate's Degree |
| Tongans | 2.2 /100 | #233 | Tragic 43.0% |
| Tlingit-Haida | 2.1 /100 | #234 | Tragic 43.0% |
| Ecuadorians | 2.0 /100 | #235 | Tragic 43.0% |
| Immigrants | St. Vincent and the Grenadines | 1.9 /100 | #236 | Tragic 42.9% |
| Immigrants | Nonimmigrants | 1.9 /100 | #237 | Tragic 42.9% |
| Iroquois | 1.7 /100 | #238 | Tragic 42.8% |
| Immigrants | Grenada | 1.3 /100 | #239 | Tragic 42.6% |
| Cree | 1.2 /100 | #240 | Tragic 42.5% |
| British West Indians | 1.0 /100 | #241 | Tragic 42.4% |
| Immigrants | West Indies | 1.0 /100 | #242 | Tragic 42.4% |
| Guyanese | 1.0 /100 | #243 | Tragic 42.3% |
| Immigrants | Liberia | 0.9 /100 | #244 | Tragic 42.3% |
| Immigrants | Cambodia | 0.9 /100 | #245 | Tragic 42.3% |
| Delaware | 0.9 /100 | #246 | Tragic 42.3% |
| Immigrants | Fiji | 0.8 /100 | #247 | Tragic 42.2% |
| Immigrants | Ecuador | 0.8 /100 | #248 | Tragic 42.2% |
| Jamaicans | 0.7 /100 | #249 | Tragic 42.1% |
| U.S. Virgin Islanders | 0.7 /100 | #250 | Tragic 42.1% |
| Immigrants | Bahamas | 0.7 /100 | #251 | Tragic 42.1% |
| French American Indians | 0.6 /100 | #252 | Tragic 42.0% |
| Indonesians | 0.6 /100 | #253 | Tragic 41.9% |