Immigrants from Sri Lanka vs Basque Associate's Degree
COMPARE
Immigrants from Sri Lanka
Basque
Associate's Degree
Associate's Degree Comparison
Immigrants from Sri Lanka
Basques
53.7%
ASSOCIATE'S DEGREE
100.0/ 100
METRIC RATING
30th/ 347
METRIC RANK
46.5%
ASSOCIATE'S DEGREE
52.8/ 100
METRIC RATING
171st/ 347
METRIC RANK
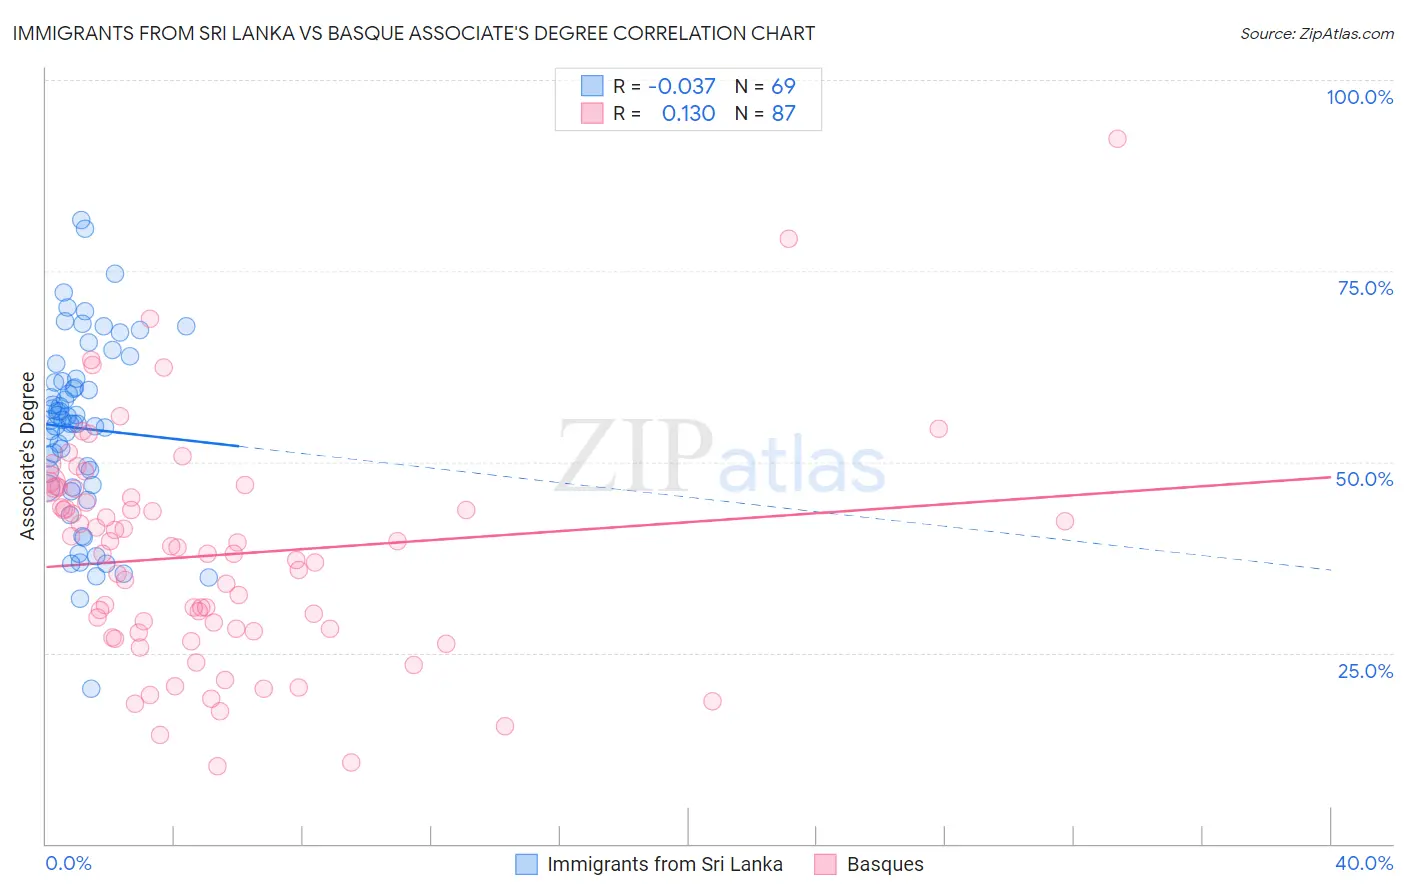
Immigrants from Sri Lanka vs Basque Associate's Degree Correlation Chart
The statistical analysis conducted on geographies consisting of 149,700,552 people shows no correlation between the proportion of Immigrants from Sri Lanka and percentage of population with at least associate's degree education in the United States with a correlation coefficient (R) of -0.037 and weighted average of 53.7%. Similarly, the statistical analysis conducted on geographies consisting of 165,778,580 people shows a poor positive correlation between the proportion of Basques and percentage of population with at least associate's degree education in the United States with a correlation coefficient (R) of 0.130 and weighted average of 46.5%, a difference of 15.5%.
Associate's Degree Correlation Summary
| Measurement | Immigrants from Sri Lanka | Basque |
| Minimum | 20.2% | 10.2% |
| Maximum | 81.7% | 92.3% |
| Range | 61.5% | 82.1% |
| Mean | 54.4% | 37.8% |
| Median | 55.4% | 38.0% |
| Interquartile 25% (IQ1) | 46.8% | 27.9% |
| Interquartile 75% (IQ3) | 60.8% | 46.5% |
| Interquartile Range (IQR) | 13.9% | 18.6% |
| Standard Deviation (Sample) | 11.9% | 14.5% |
| Standard Deviation (Population) | 11.8% | 14.4% |
Similar Demographics by Associate's Degree
Demographics Similar to Immigrants from Sri Lanka by Associate's Degree
In terms of associate's degree, the demographic groups most similar to Immigrants from Sri Lanka are Immigrants from Northern Europe (53.5%, a difference of 0.36%), Immigrants from Turkey (53.4%, a difference of 0.39%), Immigrants from France (53.9%, a difference of 0.42%), Turkish (53.9%, a difference of 0.43%), and Latvian (53.9%, a difference of 0.50%).
| Demographics | Rating | Rank | Associate's Degree |
| Burmese | 100.0 /100 | #23 | Exceptional 54.6% |
| Immigrants | Korea | 100.0 /100 | #24 | Exceptional 54.5% |
| Immigrants | Switzerland | 100.0 /100 | #25 | Exceptional 54.5% |
| Immigrants | Belgium | 100.0 /100 | #26 | Exceptional 54.5% |
| Latvians | 100.0 /100 | #27 | Exceptional 53.9% |
| Turks | 100.0 /100 | #28 | Exceptional 53.9% |
| Immigrants | France | 100.0 /100 | #29 | Exceptional 53.9% |
| Immigrants | Sri Lanka | 100.0 /100 | #30 | Exceptional 53.7% |
| Immigrants | Northern Europe | 100.0 /100 | #31 | Exceptional 53.5% |
| Immigrants | Turkey | 100.0 /100 | #32 | Exceptional 53.4% |
| Israelis | 100.0 /100 | #33 | Exceptional 53.4% |
| Bulgarians | 100.0 /100 | #34 | Exceptional 53.3% |
| Russians | 100.0 /100 | #35 | Exceptional 53.2% |
| Immigrants | Russia | 100.0 /100 | #36 | Exceptional 53.1% |
| Immigrants | Denmark | 100.0 /100 | #37 | Exceptional 53.1% |
Demographics Similar to Basques by Associate's Degree
In terms of associate's degree, the demographic groups most similar to Basques are Irish (46.5%, a difference of 0.060%), Peruvian (46.4%, a difference of 0.18%), Uruguayan (46.5%, a difference of 0.19%), Immigrants from Iraq (46.4%, a difference of 0.19%), and Immigrants from Somalia (46.5%, a difference of 0.20%).
| Demographics | Rating | Rank | Associate's Degree |
| Colombians | 62.4 /100 | #164 | Good 46.8% |
| Immigrants | South America | 59.9 /100 | #165 | Average 46.7% |
| Hungarians | 59.3 /100 | #166 | Average 46.7% |
| Immigrants | Sierra Leone | 59.2 /100 | #167 | Average 46.7% |
| Immigrants | Somalia | 55.5 /100 | #168 | Average 46.5% |
| Uruguayans | 55.4 /100 | #169 | Average 46.5% |
| Irish | 53.6 /100 | #170 | Average 46.5% |
| Basques | 52.8 /100 | #171 | Average 46.5% |
| Peruvians | 50.5 /100 | #172 | Average 46.4% |
| Immigrants | Iraq | 50.3 /100 | #173 | Average 46.4% |
| English | 50.0 /100 | #174 | Average 46.4% |
| Belgians | 48.9 /100 | #175 | Average 46.3% |
| Finns | 48.5 /100 | #176 | Average 46.3% |
| Slovaks | 48.4 /100 | #177 | Average 46.3% |
| Immigrants | Bosnia and Herzegovina | 48.3 /100 | #178 | Average 46.3% |