Immigrants from Sri Lanka vs Immigrants from Caribbean Associate's Degree
COMPARE
Immigrants from Sri Lanka
Immigrants from Caribbean
Associate's Degree
Associate's Degree Comparison
Immigrants from Sri Lanka
Immigrants from Caribbean
53.7%
ASSOCIATE'S DEGREE
100.0/ 100
METRIC RATING
30th/ 347
METRIC RANK
39.7%
ASSOCIATE'S DEGREE
0.0/ 100
METRIC RATING
286th/ 347
METRIC RANK
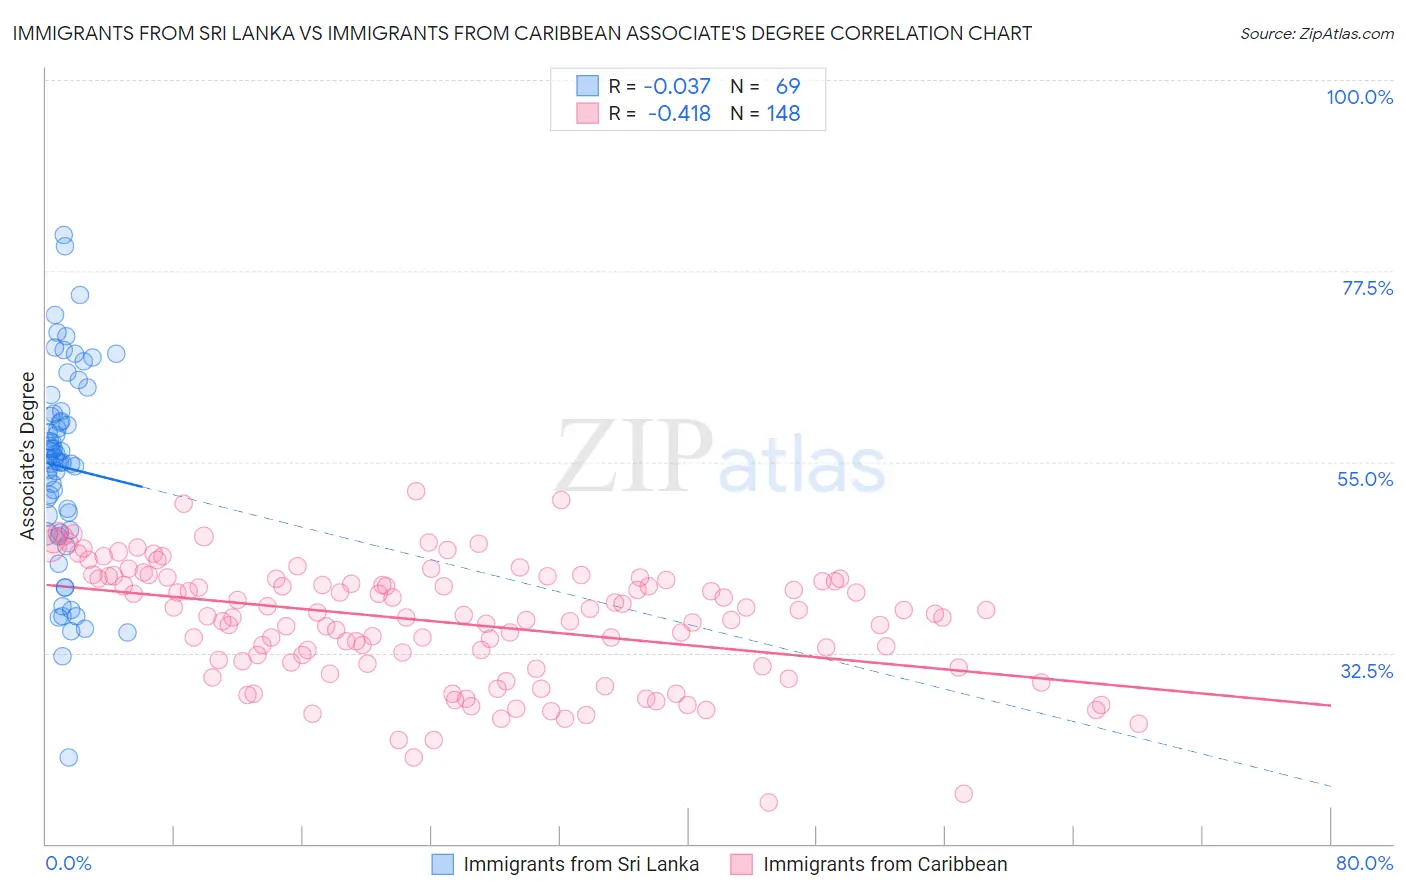
Immigrants from Sri Lanka vs Immigrants from Caribbean Associate's Degree Correlation Chart
The statistical analysis conducted on geographies consisting of 149,700,552 people shows no correlation between the proportion of Immigrants from Sri Lanka and percentage of population with at least associate's degree education in the United States with a correlation coefficient (R) of -0.037 and weighted average of 53.7%. Similarly, the statistical analysis conducted on geographies consisting of 450,016,404 people shows a moderate negative correlation between the proportion of Immigrants from Caribbean and percentage of population with at least associate's degree education in the United States with a correlation coefficient (R) of -0.418 and weighted average of 39.7%, a difference of 35.0%.
Associate's Degree Correlation Summary
| Measurement | Immigrants from Sri Lanka | Immigrants from Caribbean |
| Minimum | 20.2% | 14.8% |
| Maximum | 81.7% | 51.5% |
| Range | 61.5% | 36.6% |
| Mean | 54.4% | 36.1% |
| Median | 55.4% | 36.8% |
| Interquartile 25% (IQ1) | 46.8% | 31.3% |
| Interquartile 75% (IQ3) | 60.8% | 41.2% |
| Interquartile Range (IQR) | 13.9% | 9.9% |
| Standard Deviation (Sample) | 11.9% | 7.0% |
| Standard Deviation (Population) | 11.8% | 7.0% |
Similar Demographics by Associate's Degree
Demographics Similar to Immigrants from Sri Lanka by Associate's Degree
In terms of associate's degree, the demographic groups most similar to Immigrants from Sri Lanka are Immigrants from Northern Europe (53.5%, a difference of 0.36%), Immigrants from Turkey (53.4%, a difference of 0.39%), Immigrants from France (53.9%, a difference of 0.42%), Turkish (53.9%, a difference of 0.43%), and Latvian (53.9%, a difference of 0.50%).
| Demographics | Rating | Rank | Associate's Degree |
| Burmese | 100.0 /100 | #23 | Exceptional 54.6% |
| Immigrants | Korea | 100.0 /100 | #24 | Exceptional 54.5% |
| Immigrants | Switzerland | 100.0 /100 | #25 | Exceptional 54.5% |
| Immigrants | Belgium | 100.0 /100 | #26 | Exceptional 54.5% |
| Latvians | 100.0 /100 | #27 | Exceptional 53.9% |
| Turks | 100.0 /100 | #28 | Exceptional 53.9% |
| Immigrants | France | 100.0 /100 | #29 | Exceptional 53.9% |
| Immigrants | Sri Lanka | 100.0 /100 | #30 | Exceptional 53.7% |
| Immigrants | Northern Europe | 100.0 /100 | #31 | Exceptional 53.5% |
| Immigrants | Turkey | 100.0 /100 | #32 | Exceptional 53.4% |
| Israelis | 100.0 /100 | #33 | Exceptional 53.4% |
| Bulgarians | 100.0 /100 | #34 | Exceptional 53.3% |
| Russians | 100.0 /100 | #35 | Exceptional 53.2% |
| Immigrants | Russia | 100.0 /100 | #36 | Exceptional 53.1% |
| Immigrants | Denmark | 100.0 /100 | #37 | Exceptional 53.1% |
Demographics Similar to Immigrants from Caribbean by Associate's Degree
In terms of associate's degree, the demographic groups most similar to Immigrants from Caribbean are Aleut (39.6%, a difference of 0.26%), Immigrants from Belize (39.9%, a difference of 0.34%), Comanche (39.9%, a difference of 0.44%), Immigrants from Cuba (39.5%, a difference of 0.50%), and Haitian (40.0%, a difference of 0.55%).
| Demographics | Rating | Rank | Associate's Degree |
| Immigrants | Nicaragua | 0.1 /100 | #279 | Tragic 40.3% |
| Immigrants | Micronesia | 0.1 /100 | #280 | Tragic 40.2% |
| Immigrants | Portugal | 0.1 /100 | #281 | Tragic 40.1% |
| Bangladeshis | 0.1 /100 | #282 | Tragic 40.0% |
| Haitians | 0.1 /100 | #283 | Tragic 40.0% |
| Comanche | 0.1 /100 | #284 | Tragic 39.9% |
| Immigrants | Belize | 0.1 /100 | #285 | Tragic 39.9% |
| Immigrants | Caribbean | 0.0 /100 | #286 | Tragic 39.7% |
| Aleuts | 0.0 /100 | #287 | Tragic 39.6% |
| Immigrants | Cuba | 0.0 /100 | #288 | Tragic 39.5% |
| Central Americans | 0.0 /100 | #289 | Tragic 39.4% |
| Immigrants | Haiti | 0.0 /100 | #290 | Tragic 39.3% |
| Dominicans | 0.0 /100 | #291 | Tragic 39.3% |
| Blacks/African Americans | 0.0 /100 | #292 | Tragic 39.1% |
| Nepalese | 0.0 /100 | #293 | Tragic 39.0% |