Cambodian vs Swedish Associate's Degree
COMPARE
Cambodian
Swedish
Associate's Degree
Associate's Degree Comparison
Cambodians
Swedes
54.6%
ASSOCIATE'S DEGREE
100.0/ 100
METRIC RATING
20th/ 347
METRIC RANK
48.4%
ASSOCIATE'S DEGREE
91.5/ 100
METRIC RATING
129th/ 347
METRIC RANK
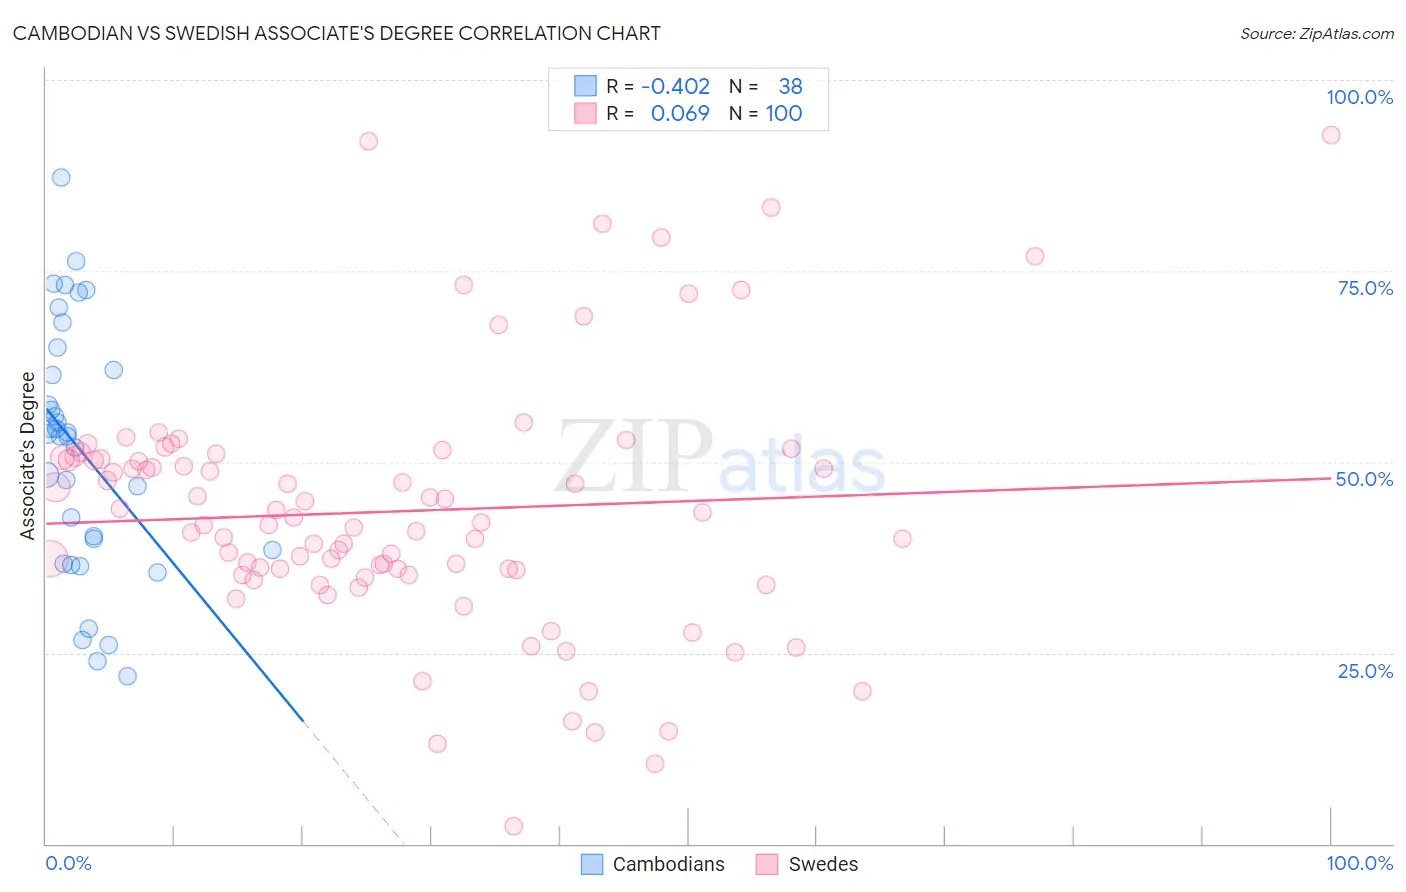
Cambodian vs Swedish Associate's Degree Correlation Chart
The statistical analysis conducted on geographies consisting of 102,512,775 people shows a moderate negative correlation between the proportion of Cambodians and percentage of population with at least associate's degree education in the United States with a correlation coefficient (R) of -0.402 and weighted average of 54.6%. Similarly, the statistical analysis conducted on geographies consisting of 539,194,795 people shows a slight positive correlation between the proportion of Swedes and percentage of population with at least associate's degree education in the United States with a correlation coefficient (R) of 0.069 and weighted average of 48.4%, a difference of 12.9%.
Associate's Degree Correlation Summary
| Measurement | Cambodian | Swedish |
| Minimum | 21.9% | 2.3% |
| Maximum | 87.2% | 92.9% |
| Range | 65.4% | 90.6% |
| Mean | 51.5% | 43.5% |
| Median | 53.5% | 41.9% |
| Interquartile 25% (IQ1) | 38.4% | 35.6% |
| Interquartile 75% (IQ3) | 62.1% | 50.4% |
| Interquartile Range (IQR) | 23.7% | 14.9% |
| Standard Deviation (Sample) | 16.3% | 16.5% |
| Standard Deviation (Population) | 16.1% | 16.4% |
Similar Demographics by Associate's Degree
Demographics Similar to Cambodians by Associate's Degree
In terms of associate's degree, the demographic groups most similar to Cambodians are Immigrants from Ireland (54.7%, a difference of 0.020%), Immigrants from Sweden (54.6%, a difference of 0.060%), Immigrants from Japan (54.6%, a difference of 0.10%), Burmese (54.6%, a difference of 0.10%), and Immigrants from Korea (54.5%, a difference of 0.19%).
| Demographics | Rating | Rank | Associate's Degree |
| Immigrants | China | 100.0 /100 | #13 | Exceptional 55.5% |
| Immigrants | Hong Kong | 100.0 /100 | #14 | Exceptional 55.4% |
| Immigrants | Eastern Asia | 100.0 /100 | #15 | Exceptional 55.4% |
| Soviet Union | 100.0 /100 | #16 | Exceptional 55.1% |
| Eastern Europeans | 100.0 /100 | #17 | Exceptional 55.0% |
| Indians (Asian) | 100.0 /100 | #18 | Exceptional 54.8% |
| Immigrants | Ireland | 100.0 /100 | #19 | Exceptional 54.7% |
| Cambodians | 100.0 /100 | #20 | Exceptional 54.6% |
| Immigrants | Sweden | 100.0 /100 | #21 | Exceptional 54.6% |
| Immigrants | Japan | 100.0 /100 | #22 | Exceptional 54.6% |
| Burmese | 100.0 /100 | #23 | Exceptional 54.6% |
| Immigrants | Korea | 100.0 /100 | #24 | Exceptional 54.5% |
| Immigrants | Switzerland | 100.0 /100 | #25 | Exceptional 54.5% |
| Immigrants | Belgium | 100.0 /100 | #26 | Exceptional 54.5% |
| Latvians | 100.0 /100 | #27 | Exceptional 53.9% |
Demographics Similar to Swedes by Associate's Degree
In terms of associate's degree, the demographic groups most similar to Swedes are Immigrants from Eastern Africa (48.4%, a difference of 0.030%), Immigrants from Jordan (48.4%, a difference of 0.060%), Immigrants from Uganda (48.5%, a difference of 0.15%), Immigrants from Syria (48.5%, a difference of 0.16%), and Icelander (48.3%, a difference of 0.16%).
| Demographics | Rating | Rank | Associate's Degree |
| Italians | 93.9 /100 | #122 | Exceptional 48.7% |
| Brazilians | 93.7 /100 | #123 | Exceptional 48.7% |
| Serbians | 92.6 /100 | #124 | Exceptional 48.5% |
| Chinese | 92.5 /100 | #125 | Exceptional 48.5% |
| Immigrants | Syria | 92.2 /100 | #126 | Exceptional 48.5% |
| Immigrants | Uganda | 92.1 /100 | #127 | Exceptional 48.5% |
| Immigrants | Eastern Africa | 91.6 /100 | #128 | Exceptional 48.4% |
| Swedes | 91.5 /100 | #129 | Exceptional 48.4% |
| Immigrants | Jordan | 91.2 /100 | #130 | Exceptional 48.4% |
| Icelanders | 90.8 /100 | #131 | Exceptional 48.3% |
| Immigrants | Albania | 89.9 /100 | #132 | Excellent 48.2% |
| Assyrians/Chaldeans/Syriacs | 89.4 /100 | #133 | Excellent 48.2% |
| Moroccans | 89.3 /100 | #134 | Excellent 48.2% |
| Europeans | 89.0 /100 | #135 | Excellent 48.2% |
| Pakistanis | 88.0 /100 | #136 | Excellent 48.1% |