Immigrants from Sri Lanka vs Colville Associate's Degree
COMPARE
Immigrants from Sri Lanka
Colville
Associate's Degree
Associate's Degree Comparison
Immigrants from Sri Lanka
Colville
53.7%
ASSOCIATE'S DEGREE
100.0/ 100
METRIC RATING
30th/ 347
METRIC RANK
38.5%
ASSOCIATE'S DEGREE
0.0/ 100
METRIC RATING
302nd/ 347
METRIC RANK
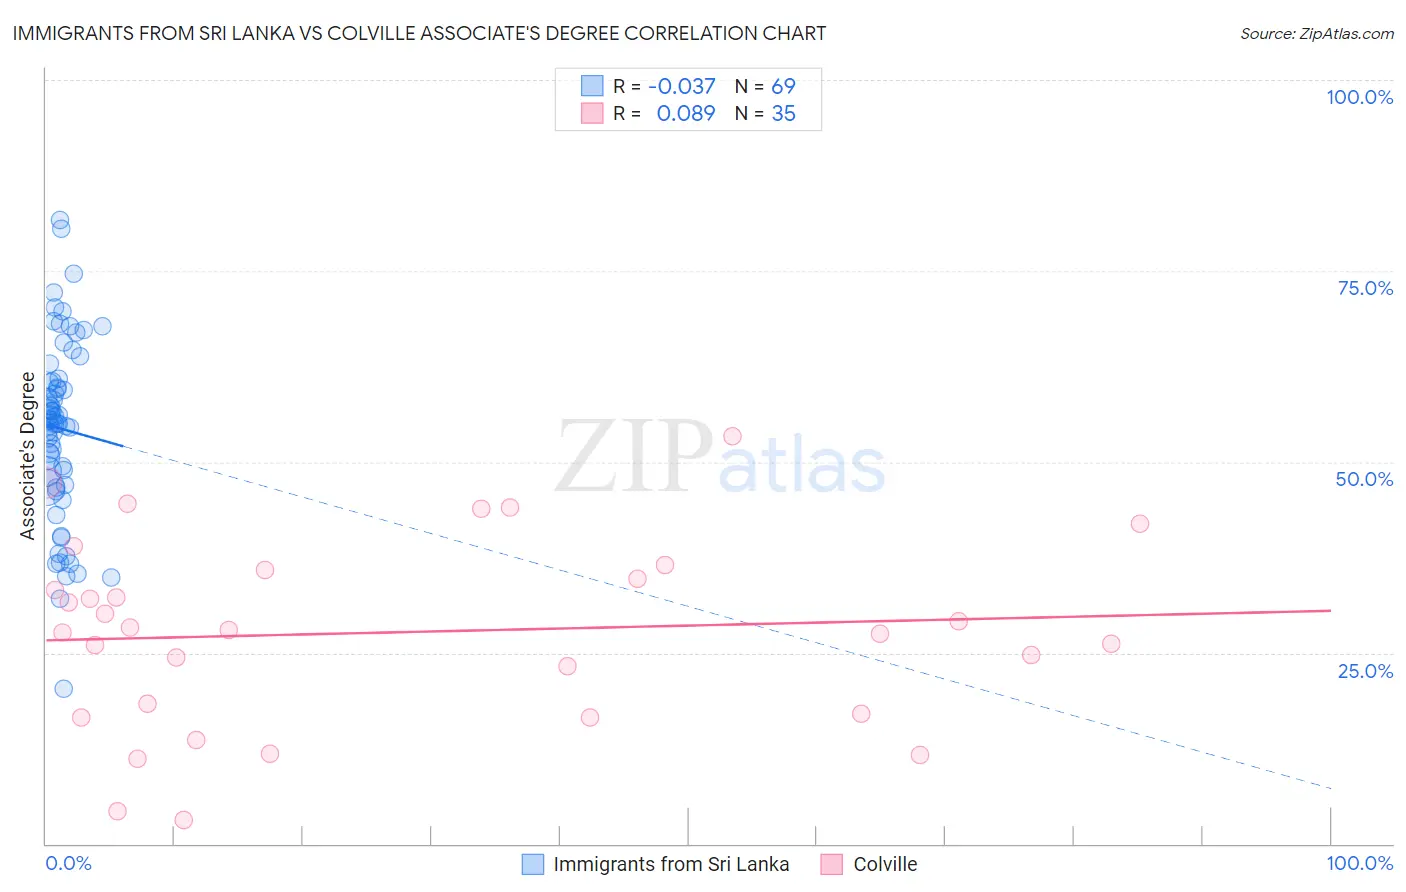
Immigrants from Sri Lanka vs Colville Associate's Degree Correlation Chart
The statistical analysis conducted on geographies consisting of 149,700,552 people shows no correlation between the proportion of Immigrants from Sri Lanka and percentage of population with at least associate's degree education in the United States with a correlation coefficient (R) of -0.037 and weighted average of 53.7%. Similarly, the statistical analysis conducted on geographies consisting of 34,684,410 people shows a slight positive correlation between the proportion of Colville and percentage of population with at least associate's degree education in the United States with a correlation coefficient (R) of 0.089 and weighted average of 38.5%, a difference of 39.3%.
Associate's Degree Correlation Summary
| Measurement | Immigrants from Sri Lanka | Colville |
| Minimum | 20.2% | 3.2% |
| Maximum | 81.7% | 53.4% |
| Range | 61.5% | 50.2% |
| Mean | 54.4% | 27.7% |
| Median | 55.4% | 27.9% |
| Interquartile 25% (IQ1) | 46.8% | 17.1% |
| Interquartile 75% (IQ3) | 60.8% | 35.8% |
| Interquartile Range (IQR) | 13.9% | 18.7% |
| Standard Deviation (Sample) | 11.9% | 12.2% |
| Standard Deviation (Population) | 11.8% | 12.1% |
Similar Demographics by Associate's Degree
Demographics Similar to Immigrants from Sri Lanka by Associate's Degree
In terms of associate's degree, the demographic groups most similar to Immigrants from Sri Lanka are Immigrants from Northern Europe (53.5%, a difference of 0.36%), Immigrants from Turkey (53.4%, a difference of 0.39%), Immigrants from France (53.9%, a difference of 0.42%), Turkish (53.9%, a difference of 0.43%), and Latvian (53.9%, a difference of 0.50%).
| Demographics | Rating | Rank | Associate's Degree |
| Burmese | 100.0 /100 | #23 | Exceptional 54.6% |
| Immigrants | Korea | 100.0 /100 | #24 | Exceptional 54.5% |
| Immigrants | Switzerland | 100.0 /100 | #25 | Exceptional 54.5% |
| Immigrants | Belgium | 100.0 /100 | #26 | Exceptional 54.5% |
| Latvians | 100.0 /100 | #27 | Exceptional 53.9% |
| Turks | 100.0 /100 | #28 | Exceptional 53.9% |
| Immigrants | France | 100.0 /100 | #29 | Exceptional 53.9% |
| Immigrants | Sri Lanka | 100.0 /100 | #30 | Exceptional 53.7% |
| Immigrants | Northern Europe | 100.0 /100 | #31 | Exceptional 53.5% |
| Immigrants | Turkey | 100.0 /100 | #32 | Exceptional 53.4% |
| Israelis | 100.0 /100 | #33 | Exceptional 53.4% |
| Bulgarians | 100.0 /100 | #34 | Exceptional 53.3% |
| Russians | 100.0 /100 | #35 | Exceptional 53.2% |
| Immigrants | Russia | 100.0 /100 | #36 | Exceptional 53.1% |
| Immigrants | Denmark | 100.0 /100 | #37 | Exceptional 53.1% |
Demographics Similar to Colville by Associate's Degree
In terms of associate's degree, the demographic groups most similar to Colville are Guatemalan (38.5%, a difference of 0.090%), Sioux (38.5%, a difference of 0.14%), Tsimshian (38.6%, a difference of 0.15%), Chickasaw (38.6%, a difference of 0.20%), and Immigrants from Honduras (38.5%, a difference of 0.21%).
| Demographics | Rating | Rank | Associate's Degree |
| Hondurans | 0.0 /100 | #295 | Tragic 38.9% |
| Cherokee | 0.0 /100 | #296 | Tragic 38.9% |
| Cape Verdeans | 0.0 /100 | #297 | Tragic 38.8% |
| Cheyenne | 0.0 /100 | #298 | Tragic 38.7% |
| Ute | 0.0 /100 | #299 | Tragic 38.6% |
| Chickasaw | 0.0 /100 | #300 | Tragic 38.6% |
| Tsimshian | 0.0 /100 | #301 | Tragic 38.6% |
| Colville | 0.0 /100 | #302 | Tragic 38.5% |
| Guatemalans | 0.0 /100 | #303 | Tragic 38.5% |
| Sioux | 0.0 /100 | #304 | Tragic 38.5% |
| Immigrants | Honduras | 0.0 /100 | #305 | Tragic 38.5% |
| Shoshone | 0.0 /100 | #306 | Tragic 38.4% |
| Immigrants | El Salvador | 0.0 /100 | #307 | Tragic 38.4% |
| Mexican American Indians | 0.0 /100 | #308 | Tragic 38.2% |
| Immigrants | Guatemala | 0.0 /100 | #309 | Tragic 38.1% |