Creek vs Immigrants from Caribbean Associate's Degree
COMPARE
Creek
Immigrants from Caribbean
Associate's Degree
Associate's Degree Comparison
Creek
Immigrants from Caribbean
37.6%
ASSOCIATE'S DEGREE
0.0/ 100
METRIC RATING
315th/ 347
METRIC RANK
39.7%
ASSOCIATE'S DEGREE
0.0/ 100
METRIC RATING
286th/ 347
METRIC RANK
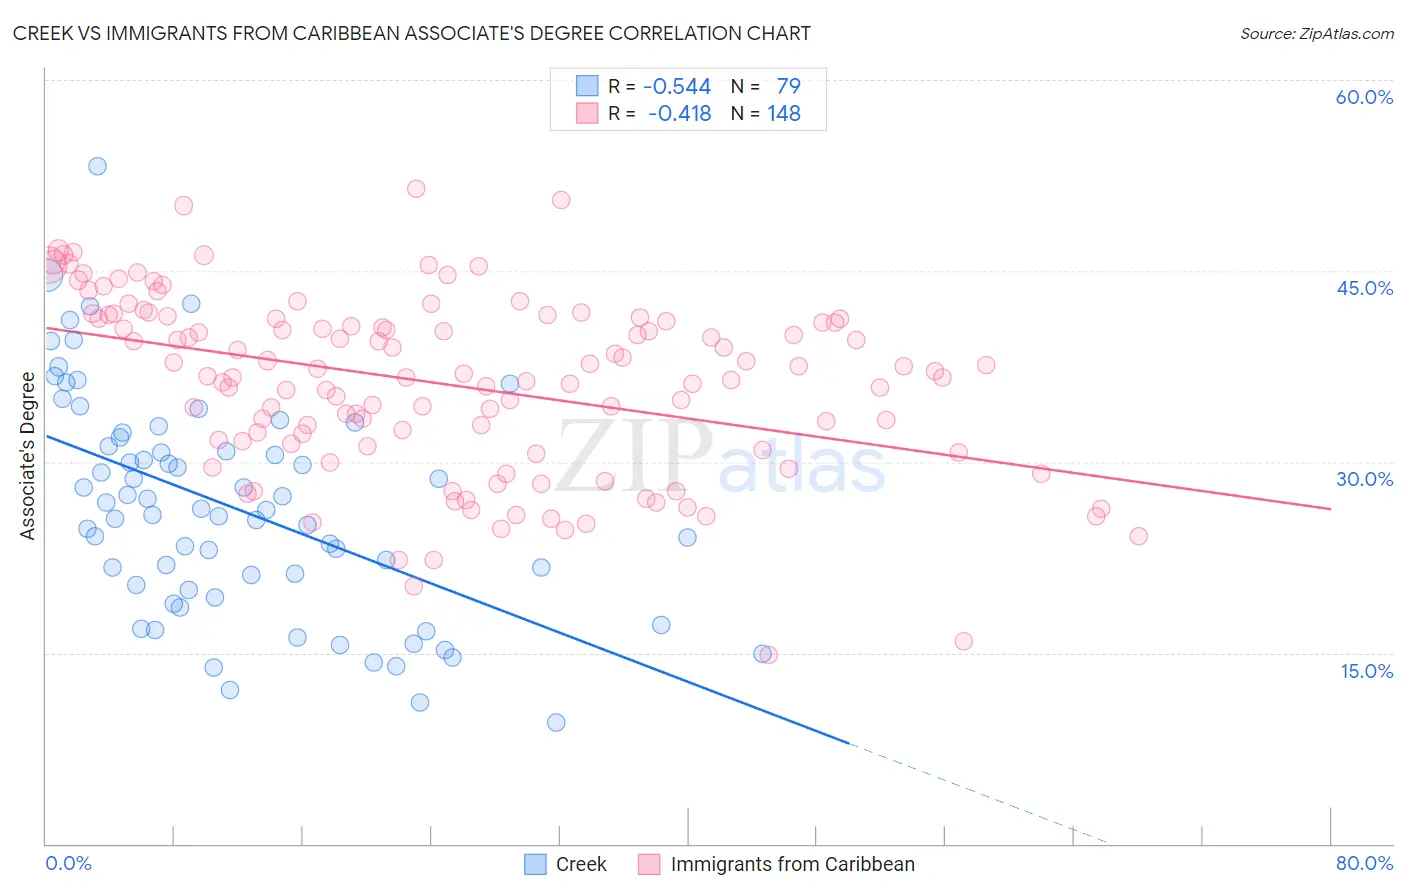
Creek vs Immigrants from Caribbean Associate's Degree Correlation Chart
The statistical analysis conducted on geographies consisting of 178,480,454 people shows a substantial negative correlation between the proportion of Creek and percentage of population with at least associate's degree education in the United States with a correlation coefficient (R) of -0.544 and weighted average of 37.6%. Similarly, the statistical analysis conducted on geographies consisting of 450,016,404 people shows a moderate negative correlation between the proportion of Immigrants from Caribbean and percentage of population with at least associate's degree education in the United States with a correlation coefficient (R) of -0.418 and weighted average of 39.7%, a difference of 5.8%.
Associate's Degree Correlation Summary
| Measurement | Creek | Immigrants from Caribbean |
| Minimum | 9.5% | 14.8% |
| Maximum | 53.2% | 51.5% |
| Range | 43.7% | 36.6% |
| Mean | 26.4% | 36.1% |
| Median | 26.2% | 36.8% |
| Interquartile 25% (IQ1) | 20.0% | 31.3% |
| Interquartile 75% (IQ3) | 31.9% | 41.2% |
| Interquartile Range (IQR) | 11.9% | 9.9% |
| Standard Deviation (Sample) | 8.7% | 7.0% |
| Standard Deviation (Population) | 8.7% | 7.0% |
Similar Demographics by Associate's Degree
Demographics Similar to Creek by Associate's Degree
In terms of associate's degree, the demographic groups most similar to Creek are Crow (37.6%, a difference of 0.010%), Yaqui (37.6%, a difference of 0.020%), Alaska Native (37.5%, a difference of 0.26%), Seminole (37.7%, a difference of 0.39%), and Hispanic or Latino (37.7%, a difference of 0.44%).
| Demographics | Rating | Rank | Associate's Degree |
| Mexican American Indians | 0.0 /100 | #308 | Tragic 38.2% |
| Immigrants | Guatemala | 0.0 /100 | #309 | Tragic 38.1% |
| Immigrants | Dominican Republic | 0.0 /100 | #310 | Tragic 37.9% |
| Immigrants | Latin America | 0.0 /100 | #311 | Tragic 37.9% |
| Choctaw | 0.0 /100 | #312 | Tragic 37.8% |
| Hispanics or Latinos | 0.0 /100 | #313 | Tragic 37.7% |
| Seminole | 0.0 /100 | #314 | Tragic 37.7% |
| Creek | 0.0 /100 | #315 | Tragic 37.6% |
| Crow | 0.0 /100 | #316 | Tragic 37.6% |
| Yaqui | 0.0 /100 | #317 | Tragic 37.6% |
| Alaska Natives | 0.0 /100 | #318 | Tragic 37.5% |
| Fijians | 0.0 /100 | #319 | Tragic 37.4% |
| Cajuns | 0.0 /100 | #320 | Tragic 37.4% |
| Immigrants | Yemen | 0.0 /100 | #321 | Tragic 37.3% |
| Pennsylvania Germans | 0.0 /100 | #322 | Tragic 37.2% |
Demographics Similar to Immigrants from Caribbean by Associate's Degree
In terms of associate's degree, the demographic groups most similar to Immigrants from Caribbean are Aleut (39.6%, a difference of 0.26%), Immigrants from Belize (39.9%, a difference of 0.34%), Comanche (39.9%, a difference of 0.44%), Immigrants from Cuba (39.5%, a difference of 0.50%), and Haitian (40.0%, a difference of 0.55%).
| Demographics | Rating | Rank | Associate's Degree |
| Immigrants | Nicaragua | 0.1 /100 | #279 | Tragic 40.3% |
| Immigrants | Micronesia | 0.1 /100 | #280 | Tragic 40.2% |
| Immigrants | Portugal | 0.1 /100 | #281 | Tragic 40.1% |
| Bangladeshis | 0.1 /100 | #282 | Tragic 40.0% |
| Haitians | 0.1 /100 | #283 | Tragic 40.0% |
| Comanche | 0.1 /100 | #284 | Tragic 39.9% |
| Immigrants | Belize | 0.1 /100 | #285 | Tragic 39.9% |
| Immigrants | Caribbean | 0.0 /100 | #286 | Tragic 39.7% |
| Aleuts | 0.0 /100 | #287 | Tragic 39.6% |
| Immigrants | Cuba | 0.0 /100 | #288 | Tragic 39.5% |
| Central Americans | 0.0 /100 | #289 | Tragic 39.4% |
| Immigrants | Haiti | 0.0 /100 | #290 | Tragic 39.3% |
| Dominicans | 0.0 /100 | #291 | Tragic 39.3% |
| Blacks/African Americans | 0.0 /100 | #292 | Tragic 39.1% |
| Nepalese | 0.0 /100 | #293 | Tragic 39.0% |