Immigrants from Sri Lanka vs Sri Lankan 3rd Grade
COMPARE
Immigrants from Sri Lanka
Sri Lankan
3rd Grade
3rd Grade Comparison
Immigrants from Sri Lanka
Sri Lankans
97.7%
3RD GRADE
45.1/ 100
METRIC RATING
180th/ 347
METRIC RANK
96.7%
3RD GRADE
0.0/ 100
METRIC RATING
309th/ 347
METRIC RANK
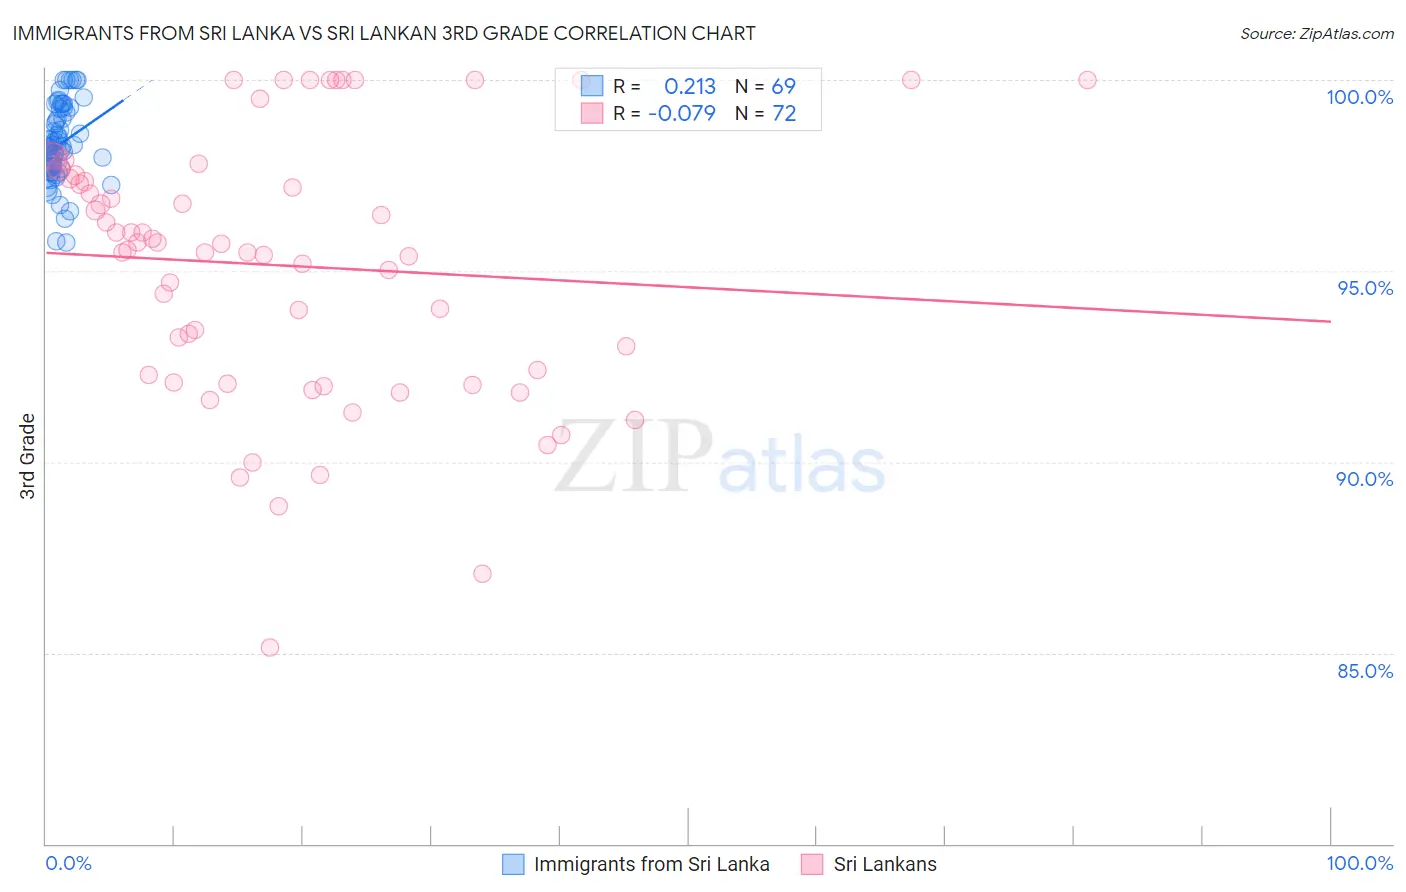
Immigrants from Sri Lanka vs Sri Lankan 3rd Grade Correlation Chart
The statistical analysis conducted on geographies consisting of 149,700,552 people shows a weak positive correlation between the proportion of Immigrants from Sri Lanka and percentage of population with at least 3rd grade education in the United States with a correlation coefficient (R) of 0.213 and weighted average of 97.7%. Similarly, the statistical analysis conducted on geographies consisting of 440,593,746 people shows a slight negative correlation between the proportion of Sri Lankans and percentage of population with at least 3rd grade education in the United States with a correlation coefficient (R) of -0.079 and weighted average of 96.7%, a difference of 1.1%.
3rd Grade Correlation Summary
| Measurement | Immigrants from Sri Lanka | Sri Lankan |
| Minimum | 95.7% | 85.2% |
| Maximum | 100.0% | 100.0% |
| Range | 4.3% | 14.8% |
| Mean | 98.3% | 95.1% |
| Median | 98.3% | 95.6% |
| Interquartile 25% (IQ1) | 97.7% | 92.2% |
| Interquartile 75% (IQ3) | 99.2% | 97.5% |
| Interquartile Range (IQR) | 1.5% | 5.3% |
| Standard Deviation (Sample) | 1.0% | 3.4% |
| Standard Deviation (Population) | 1.00% | 3.4% |
Similar Demographics by 3rd Grade
Demographics Similar to Immigrants from Sri Lanka by 3rd Grade
In terms of 3rd grade, the demographic groups most similar to Immigrants from Sri Lanka are Immigrants from Brazil (97.7%, a difference of 0.0%), Immigrants from Belarus (97.7%, a difference of 0.0%), Immigrants from Venezuela (97.7%, a difference of 0.0%), Immigrants from Micronesia (97.8%, a difference of 0.010%), and Immigrants from Poland (97.8%, a difference of 0.010%).
| Demographics | Rating | Rank | 3rd Grade |
| Immigrants | Korea | 50.9 /100 | #173 | Average 97.8% |
| Navajo | 50.0 /100 | #174 | Average 97.8% |
| Immigrants | Micronesia | 47.6 /100 | #175 | Average 97.8% |
| Immigrants | Poland | 47.1 /100 | #176 | Average 97.8% |
| Egyptians | 46.6 /100 | #177 | Average 97.7% |
| Immigrants | Brazil | 46.4 /100 | #178 | Average 97.7% |
| Immigrants | Belarus | 45.9 /100 | #179 | Average 97.7% |
| Immigrants | Sri Lanka | 45.1 /100 | #180 | Average 97.7% |
| Immigrants | Venezuela | 44.4 /100 | #181 | Average 97.7% |
| Argentineans | 42.9 /100 | #182 | Average 97.7% |
| Arabs | 40.0 /100 | #183 | Fair 97.7% |
| Immigrants | Kazakhstan | 37.4 /100 | #184 | Fair 97.7% |
| Immigrants | Argentina | 37.0 /100 | #185 | Fair 97.7% |
| Portuguese | 36.2 /100 | #186 | Fair 97.7% |
| Natives/Alaskans | 35.2 /100 | #187 | Fair 97.7% |
Demographics Similar to Sri Lankans by 3rd Grade
In terms of 3rd grade, the demographic groups most similar to Sri Lankans are Nicaraguan (96.7%, a difference of 0.0%), Immigrants from Haiti (96.7%, a difference of 0.0%), Guyanese (96.7%, a difference of 0.020%), Cape Verdean (96.6%, a difference of 0.030%), and Central American Indian (96.7%, a difference of 0.050%).
| Demographics | Rating | Rank | 3rd Grade |
| Immigrants | Somalia | 0.0 /100 | #302 | Tragic 96.8% |
| Ecuadorians | 0.0 /100 | #303 | Tragic 96.7% |
| Immigrants | Caribbean | 0.0 /100 | #304 | Tragic 96.7% |
| Central American Indians | 0.0 /100 | #305 | Tragic 96.7% |
| Guyanese | 0.0 /100 | #306 | Tragic 96.7% |
| Nicaraguans | 0.0 /100 | #307 | Tragic 96.7% |
| Immigrants | Haiti | 0.0 /100 | #308 | Tragic 96.7% |
| Sri Lankans | 0.0 /100 | #309 | Tragic 96.7% |
| Cape Verdeans | 0.0 /100 | #310 | Tragic 96.6% |
| Immigrants | Guyana | 0.0 /100 | #311 | Tragic 96.6% |
| Immigrants | Laos | 0.0 /100 | #312 | Tragic 96.6% |
| Immigrants | Ecuador | 0.0 /100 | #313 | Tragic 96.6% |
| Belizeans | 0.0 /100 | #314 | Tragic 96.6% |
| Immigrants | Azores | 0.0 /100 | #315 | Tragic 96.6% |
| Immigrants | Burma/Myanmar | 0.0 /100 | #316 | Tragic 96.6% |