Immigrants from Sri Lanka vs Dominican Unemployment Among Ages 16 to 19 years
COMPARE
Immigrants from Sri Lanka
Dominican
Unemployment Among Ages 16 to 19 years
Unemployment Among Ages 16 to 19 years Comparison
Immigrants from Sri Lanka
Dominicans
17.1%
UNEMPLOYMENT AMONG AGES 16 TO 19 YEARS
92.0/ 100
METRIC RATING
117th/ 347
METRIC RANK
23.6%
UNEMPLOYMENT AMONG AGES 16 TO 19 YEARS
0.0/ 100
METRIC RATING
330th/ 347
METRIC RANK
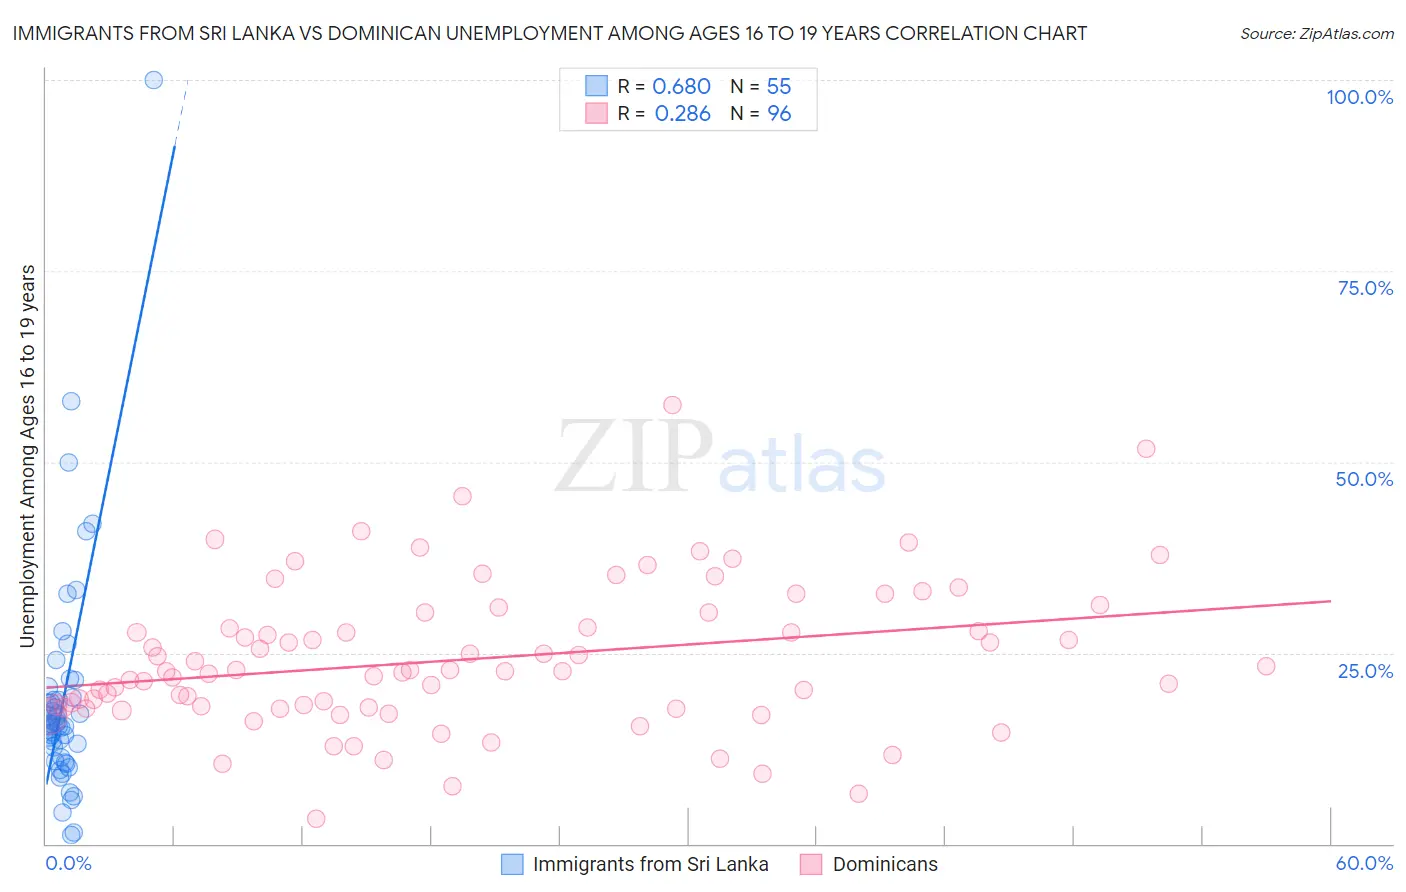
Immigrants from Sri Lanka vs Dominican Unemployment Among Ages 16 to 19 years Correlation Chart
The statistical analysis conducted on geographies consisting of 146,697,402 people shows a significant positive correlation between the proportion of Immigrants from Sri Lanka and unemployment rate among population between the ages 16 and 19 in the United States with a correlation coefficient (R) of 0.680 and weighted average of 17.1%. Similarly, the statistical analysis conducted on geographies consisting of 338,410,900 people shows a weak positive correlation between the proportion of Dominicans and unemployment rate among population between the ages 16 and 19 in the United States with a correlation coefficient (R) of 0.286 and weighted average of 23.6%, a difference of 38.6%.
Unemployment Among Ages 16 to 19 years Correlation Summary
| Measurement | Immigrants from Sri Lanka | Dominican |
| Minimum | 1.2% | 3.2% |
| Maximum | 100.0% | 57.4% |
| Range | 98.8% | 54.2% |
| Mean | 19.1% | 24.2% |
| Median | 15.7% | 22.6% |
| Interquartile 25% (IQ1) | 11.2% | 17.8% |
| Interquartile 75% (IQ3) | 19.2% | 29.3% |
| Interquartile Range (IQR) | 8.0% | 11.4% |
| Standard Deviation (Sample) | 15.5% | 9.6% |
| Standard Deviation (Population) | 15.3% | 9.6% |
Similar Demographics by Unemployment Among Ages 16 to 19 years
Demographics Similar to Immigrants from Sri Lanka by Unemployment Among Ages 16 to 19 years
In terms of unemployment among ages 16 to 19 years, the demographic groups most similar to Immigrants from Sri Lanka are Venezuelan (17.1%, a difference of 0.020%), Immigrants from Korea (17.1%, a difference of 0.030%), Brazilian (17.1%, a difference of 0.050%), Hungarian (17.1%, a difference of 0.060%), and Immigrants from Middle Africa (17.1%, a difference of 0.17%).
| Demographics | Rating | Rank | Unemployment Among Ages 16 to 19 years |
| Immigrants | Netherlands | 93.9 /100 | #110 | Exceptional 17.0% |
| Immigrants | Asia | 93.9 /100 | #111 | Exceptional 17.0% |
| Immigrants | Iraq | 93.7 /100 | #112 | Exceptional 17.0% |
| Icelanders | 93.4 /100 | #113 | Exceptional 17.0% |
| Immigrants | Poland | 93.1 /100 | #114 | Exceptional 17.0% |
| Brazilians | 92.3 /100 | #115 | Exceptional 17.1% |
| Immigrants | Korea | 92.2 /100 | #116 | Exceptional 17.1% |
| Immigrants | Sri Lanka | 92.0 /100 | #117 | Exceptional 17.1% |
| Venezuelans | 91.8 /100 | #118 | Exceptional 17.1% |
| Hungarians | 91.6 /100 | #119 | Exceptional 17.1% |
| Immigrants | Middle Africa | 90.9 /100 | #120 | Exceptional 17.1% |
| Immigrants | Moldova | 90.7 /100 | #121 | Exceptional 17.1% |
| Immigrants | South Eastern Asia | 90.7 /100 | #122 | Exceptional 17.1% |
| Immigrants | Laos | 88.8 /100 | #123 | Excellent 17.1% |
| Syrians | 88.6 /100 | #124 | Excellent 17.1% |
Demographics Similar to Dominicans by Unemployment Among Ages 16 to 19 years
In terms of unemployment among ages 16 to 19 years, the demographic groups most similar to Dominicans are Tlingit-Haida (23.5%, a difference of 0.44%), British West Indian (24.0%, a difference of 1.4%), Immigrants from Dominican Republic (23.3%, a difference of 1.5%), Immigrants from Barbados (24.0%, a difference of 1.6%), and Pima (23.1%, a difference of 2.2%).
| Demographics | Rating | Rank | Unemployment Among Ages 16 to 19 years |
| Yakama | 0.0 /100 | #323 | Tragic 22.5% |
| Immigrants | Armenia | 0.0 /100 | #324 | Tragic 22.6% |
| Trinidadians and Tobagonians | 0.0 /100 | #325 | Tragic 22.6% |
| Immigrants | Trinidad and Tobago | 0.0 /100 | #326 | Tragic 23.1% |
| Pima | 0.0 /100 | #327 | Tragic 23.1% |
| Immigrants | Dominican Republic | 0.0 /100 | #328 | Tragic 23.3% |
| Tlingit-Haida | 0.0 /100 | #329 | Tragic 23.5% |
| Dominicans | 0.0 /100 | #330 | Tragic 23.6% |
| British West Indians | 0.0 /100 | #331 | Tragic 24.0% |
| Immigrants | Barbados | 0.0 /100 | #332 | Tragic 24.0% |
| Paiute | 0.0 /100 | #333 | Tragic 24.4% |
| Guyanese | 0.0 /100 | #334 | Tragic 24.8% |
| Arapaho | 0.0 /100 | #335 | Tragic 25.2% |
| Kiowa | 0.0 /100 | #336 | Tragic 25.2% |
| Immigrants | Guyana | 0.0 /100 | #337 | Tragic 25.5% |