Immigrants from Norway vs Colville Associate's Degree
COMPARE
Immigrants from Norway
Colville
Associate's Degree
Associate's Degree Comparison
Immigrants from Norway
Colville
52.2%
ASSOCIATE'S DEGREE
99.9/ 100
METRIC RATING
48th/ 347
METRIC RANK
38.5%
ASSOCIATE'S DEGREE
0.0/ 100
METRIC RATING
302nd/ 347
METRIC RANK
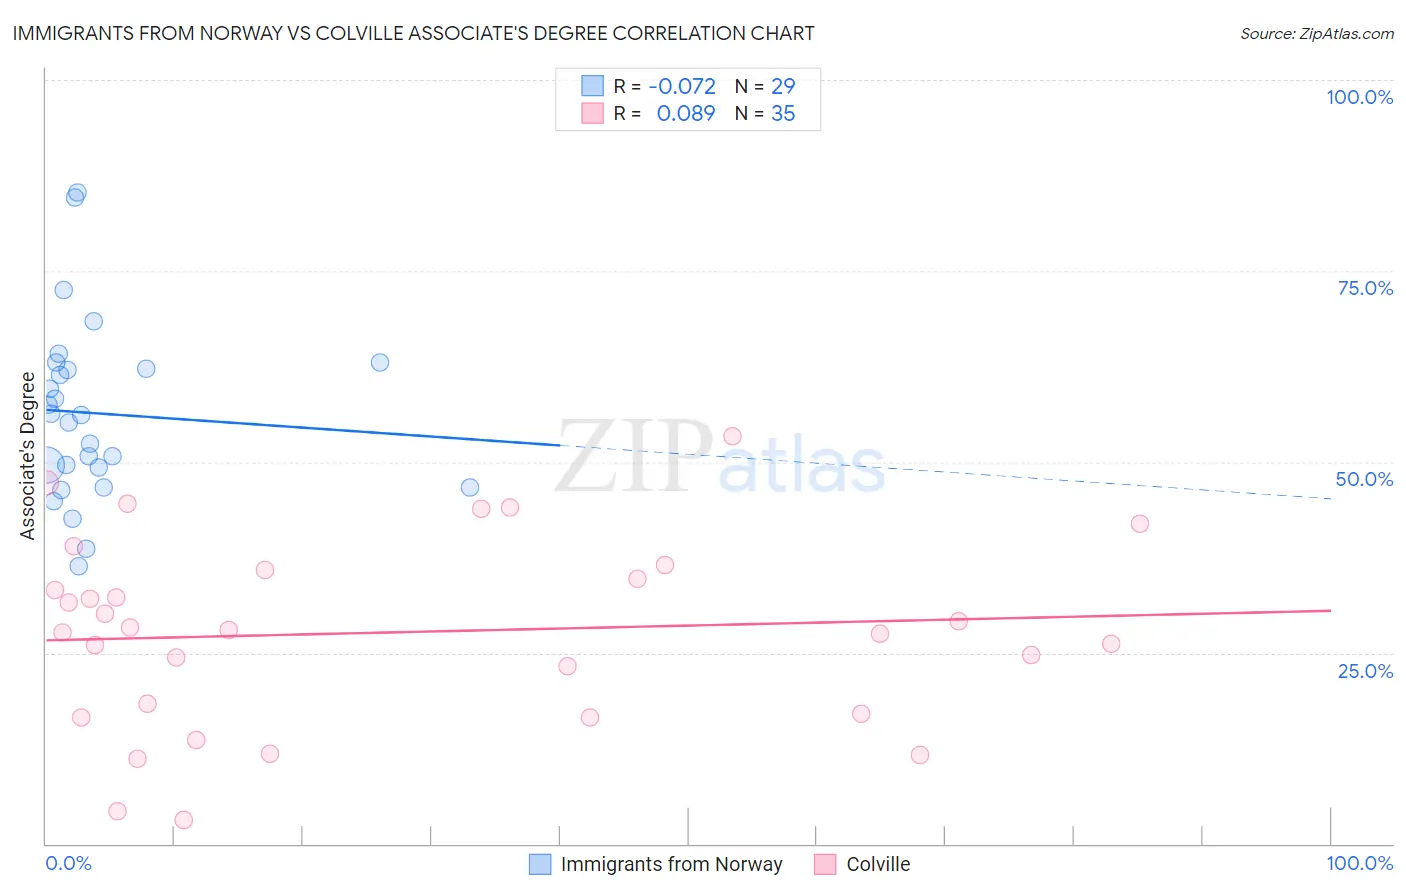
Immigrants from Norway vs Colville Associate's Degree Correlation Chart
The statistical analysis conducted on geographies consisting of 116,713,778 people shows a slight negative correlation between the proportion of Immigrants from Norway and percentage of population with at least associate's degree education in the United States with a correlation coefficient (R) of -0.072 and weighted average of 52.2%. Similarly, the statistical analysis conducted on geographies consisting of 34,684,410 people shows a slight positive correlation between the proportion of Colville and percentage of population with at least associate's degree education in the United States with a correlation coefficient (R) of 0.089 and weighted average of 38.5%, a difference of 35.6%.
Associate's Degree Correlation Summary
| Measurement | Immigrants from Norway | Colville |
| Minimum | 36.3% | 3.2% |
| Maximum | 85.3% | 53.4% |
| Range | 49.0% | 50.2% |
| Mean | 56.3% | 27.7% |
| Median | 56.2% | 27.9% |
| Interquartile 25% (IQ1) | 47.9% | 17.1% |
| Interquartile 75% (IQ3) | 62.6% | 35.8% |
| Interquartile Range (IQR) | 14.7% | 18.7% |
| Standard Deviation (Sample) | 11.7% | 12.2% |
| Standard Deviation (Population) | 11.5% | 12.1% |
Similar Demographics by Associate's Degree
Demographics Similar to Immigrants from Norway by Associate's Degree
In terms of associate's degree, the demographic groups most similar to Immigrants from Norway are Immigrants from Austria (52.1%, a difference of 0.20%), Asian (52.1%, a difference of 0.21%), Immigrants from Kuwait (52.4%, a difference of 0.26%), Immigrants from Bulgaria (52.4%, a difference of 0.27%), and Immigrants from Greece (52.1%, a difference of 0.29%).
| Demographics | Rating | Rank | Associate's Degree |
| Immigrants | Saudi Arabia | 99.9 /100 | #41 | Exceptional 52.6% |
| Immigrants | Malaysia | 99.9 /100 | #42 | Exceptional 52.5% |
| Immigrants | South Africa | 99.9 /100 | #43 | Exceptional 52.5% |
| Estonians | 99.9 /100 | #44 | Exceptional 52.5% |
| Immigrants | Lithuania | 99.9 /100 | #45 | Exceptional 52.4% |
| Immigrants | Bulgaria | 99.9 /100 | #46 | Exceptional 52.4% |
| Immigrants | Kuwait | 99.9 /100 | #47 | Exceptional 52.4% |
| Immigrants | Norway | 99.9 /100 | #48 | Exceptional 52.2% |
| Immigrants | Austria | 99.9 /100 | #49 | Exceptional 52.1% |
| Asians | 99.9 /100 | #50 | Exceptional 52.1% |
| Immigrants | Greece | 99.9 /100 | #51 | Exceptional 52.1% |
| Bolivians | 99.8 /100 | #52 | Exceptional 52.0% |
| Immigrants | Asia | 99.8 /100 | #53 | Exceptional 52.0% |
| Immigrants | Spain | 99.8 /100 | #54 | Exceptional 51.9% |
| Australians | 99.8 /100 | #55 | Exceptional 51.9% |
Demographics Similar to Colville by Associate's Degree
In terms of associate's degree, the demographic groups most similar to Colville are Guatemalan (38.5%, a difference of 0.090%), Sioux (38.5%, a difference of 0.14%), Tsimshian (38.6%, a difference of 0.15%), Chickasaw (38.6%, a difference of 0.20%), and Immigrants from Honduras (38.5%, a difference of 0.21%).
| Demographics | Rating | Rank | Associate's Degree |
| Hondurans | 0.0 /100 | #295 | Tragic 38.9% |
| Cherokee | 0.0 /100 | #296 | Tragic 38.9% |
| Cape Verdeans | 0.0 /100 | #297 | Tragic 38.8% |
| Cheyenne | 0.0 /100 | #298 | Tragic 38.7% |
| Ute | 0.0 /100 | #299 | Tragic 38.6% |
| Chickasaw | 0.0 /100 | #300 | Tragic 38.6% |
| Tsimshian | 0.0 /100 | #301 | Tragic 38.6% |
| Colville | 0.0 /100 | #302 | Tragic 38.5% |
| Guatemalans | 0.0 /100 | #303 | Tragic 38.5% |
| Sioux | 0.0 /100 | #304 | Tragic 38.5% |
| Immigrants | Honduras | 0.0 /100 | #305 | Tragic 38.5% |
| Shoshone | 0.0 /100 | #306 | Tragic 38.4% |
| Immigrants | El Salvador | 0.0 /100 | #307 | Tragic 38.4% |
| Mexican American Indians | 0.0 /100 | #308 | Tragic 38.2% |
| Immigrants | Guatemala | 0.0 /100 | #309 | Tragic 38.1% |