Yugoslavian vs Immigrants from Iran 7th Grade
COMPARE
Yugoslavian
Immigrants from Iran
7th Grade
7th Grade Comparison
Yugoslavians
Immigrants from Iran
96.8%
7TH GRADE
99.3/ 100
METRIC RATING
80th/ 347
METRIC RANK
96.0%
7TH GRADE
47.8/ 100
METRIC RATING
179th/ 347
METRIC RANK
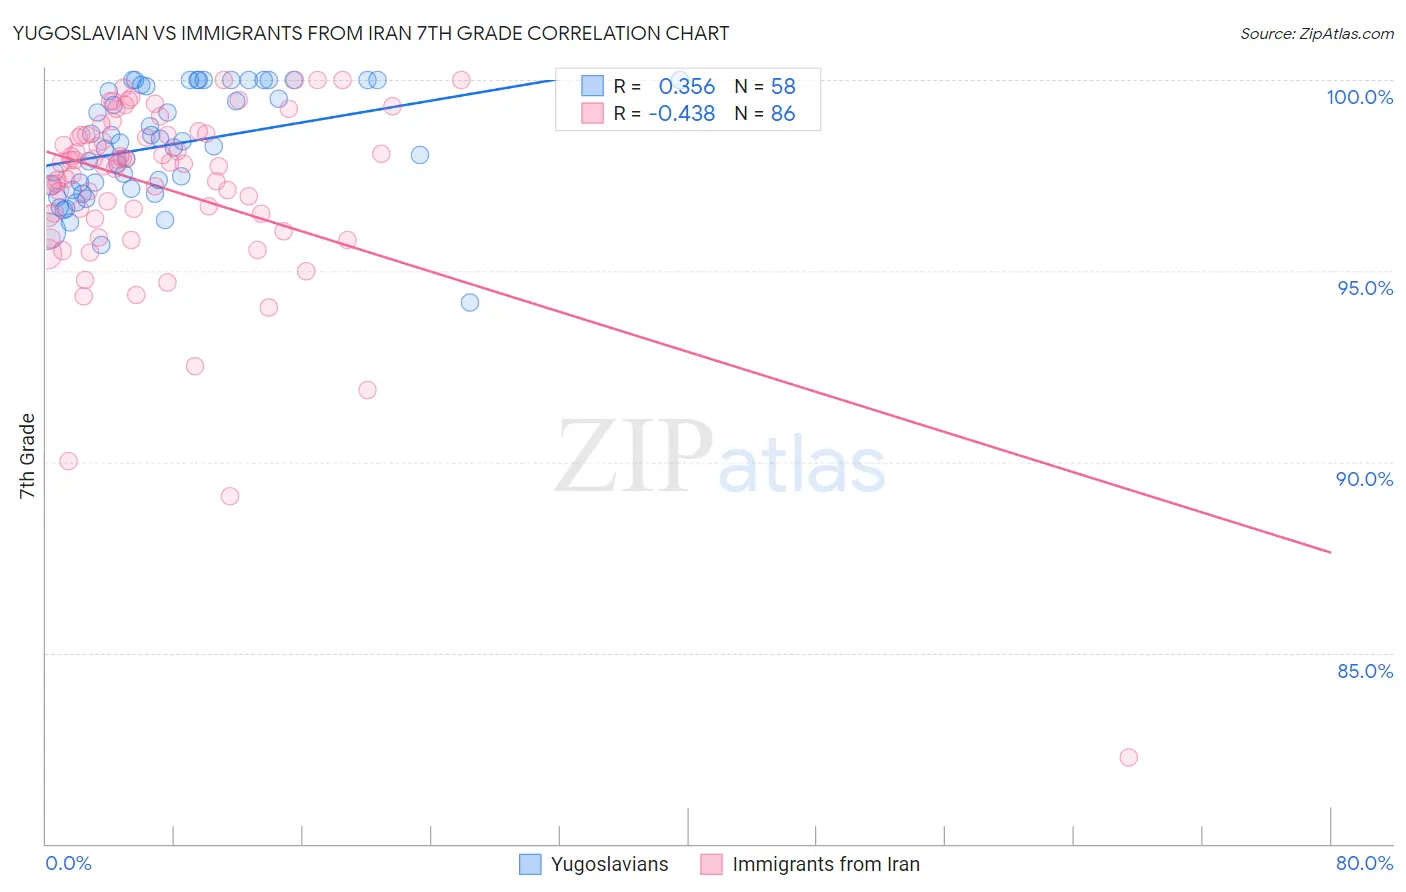
Yugoslavian vs Immigrants from Iran 7th Grade Correlation Chart
The statistical analysis conducted on geographies consisting of 285,618,157 people shows a mild positive correlation between the proportion of Yugoslavians and percentage of population with at least 7th grade education in the United States with a correlation coefficient (R) of 0.356 and weighted average of 96.8%. Similarly, the statistical analysis conducted on geographies consisting of 279,867,553 people shows a moderate negative correlation between the proportion of Immigrants from Iran and percentage of population with at least 7th grade education in the United States with a correlation coefficient (R) of -0.438 and weighted average of 96.0%, a difference of 0.78%.
7th Grade Correlation Summary
| Measurement | Yugoslavian | Immigrants from Iran |
| Minimum | 94.2% | 82.3% |
| Maximum | 100.0% | 100.0% |
| Range | 5.8% | 17.7% |
| Mean | 98.3% | 97.1% |
| Median | 98.3% | 97.8% |
| Interquartile 25% (IQ1) | 97.1% | 96.4% |
| Interquartile 75% (IQ3) | 99.9% | 98.6% |
| Interquartile Range (IQR) | 2.7% | 2.1% |
| Standard Deviation (Sample) | 1.4% | 2.6% |
| Standard Deviation (Population) | 1.4% | 2.6% |
Similar Demographics by 7th Grade
Demographics Similar to Yugoslavians by 7th Grade
In terms of 7th grade, the demographic groups most similar to Yugoslavians are Immigrants from Netherlands (96.8%, a difference of 0.0%), Cypriot (96.8%, a difference of 0.0%), Immigrants from Ireland (96.8%, a difference of 0.010%), Cherokee (96.8%, a difference of 0.010%), and Delaware (96.8%, a difference of 0.020%).
| Demographics | Rating | Rank | 7th Grade |
| Arapaho | 99.5 /100 | #73 | Exceptional 96.8% |
| Immigrants | England | 99.5 /100 | #74 | Exceptional 96.8% |
| Zimbabweans | 99.5 /100 | #75 | Exceptional 96.8% |
| Immigrants | Ireland | 99.4 /100 | #76 | Exceptional 96.8% |
| Cherokee | 99.4 /100 | #77 | Exceptional 96.8% |
| Immigrants | Netherlands | 99.3 /100 | #78 | Exceptional 96.8% |
| Cypriots | 99.3 /100 | #79 | Exceptional 96.8% |
| Yugoslavians | 99.3 /100 | #80 | Exceptional 96.8% |
| Delaware | 99.2 /100 | #81 | Exceptional 96.8% |
| Chickasaw | 99.2 /100 | #82 | Exceptional 96.7% |
| Icelanders | 99.1 /100 | #83 | Exceptional 96.7% |
| Romanians | 99.1 /100 | #84 | Exceptional 96.7% |
| Kiowa | 99.1 /100 | #85 | Exceptional 96.7% |
| Turks | 99.1 /100 | #86 | Exceptional 96.7% |
| Immigrants | Belgium | 99.0 /100 | #87 | Exceptional 96.7% |
Demographics Similar to Immigrants from Iran by 7th Grade
In terms of 7th grade, the demographic groups most similar to Immigrants from Iran are Marshallese (96.0%, a difference of 0.0%), Mongolian (96.0%, a difference of 0.010%), Black/African American (96.0%, a difference of 0.010%), Chilean (96.0%, a difference of 0.010%), and Immigrants from Korea (96.0%, a difference of 0.010%).
| Demographics | Rating | Rank | 7th Grade |
| Venezuelans | 51.4 /100 | #172 | Average 96.0% |
| Immigrants | Albania | 50.4 /100 | #173 | Average 96.0% |
| Mongolians | 50.0 /100 | #174 | Average 96.0% |
| Blacks/African Americans | 49.5 /100 | #175 | Average 96.0% |
| Chileans | 49.3 /100 | #176 | Average 96.0% |
| Immigrants | Korea | 49.2 /100 | #177 | Average 96.0% |
| Marshallese | 48.4 /100 | #178 | Average 96.0% |
| Immigrants | Iran | 47.8 /100 | #179 | Average 96.0% |
| Immigrants | Brazil | 46.8 /100 | #180 | Average 96.0% |
| Pakistanis | 44.5 /100 | #181 | Average 96.0% |
| Iraqis | 41.2 /100 | #182 | Average 96.0% |
| Immigrants | Spain | 38.8 /100 | #183 | Fair 96.0% |
| Sierra Leoneans | 37.5 /100 | #184 | Fair 96.0% |
| Brazilians | 37.3 /100 | #185 | Fair 96.0% |
| Immigrants | Iraq | 36.1 /100 | #186 | Fair 96.0% |