Yugoslavian vs French Canadian No Schooling Completed
COMPARE
Yugoslavian
French Canadian
No Schooling Completed
No Schooling Completed Comparison
Yugoslavians
French Canadians
1.8%
NO SCHOOLING COMPLETED
97.2/ 100
METRIC RATING
107th/ 347
METRIC RANK
1.5%
NO SCHOOLING COMPLETED
100.0/ 100
METRIC RATING
28th/ 347
METRIC RANK
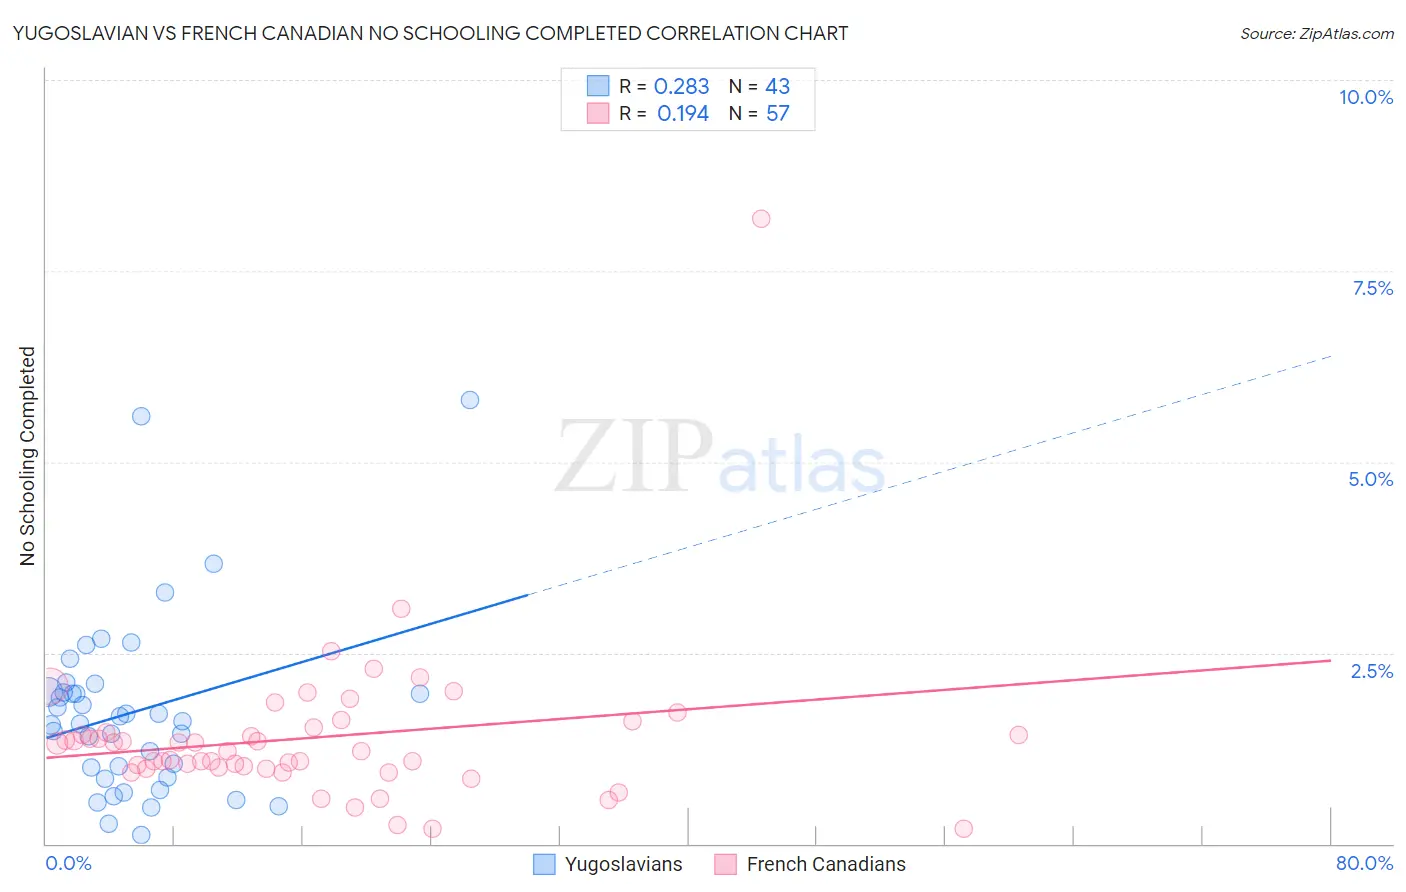
Yugoslavian vs French Canadian No Schooling Completed Correlation Chart
The statistical analysis conducted on geographies consisting of 283,637,771 people shows a weak positive correlation between the proportion of Yugoslavians and percentage of population with no schooling in the United States with a correlation coefficient (R) of 0.283 and weighted average of 1.8%. Similarly, the statistical analysis conducted on geographies consisting of 491,496,199 people shows a poor positive correlation between the proportion of French Canadians and percentage of population with no schooling in the United States with a correlation coefficient (R) of 0.194 and weighted average of 1.5%, a difference of 22.7%.
No Schooling Completed Correlation Summary
| Measurement | Yugoslavian | French Canadian |
| Minimum | 0.12% | 0.20% |
| Maximum | 5.8% | 8.2% |
| Range | 5.7% | 8.0% |
| Mean | 1.7% | 1.4% |
| Median | 1.6% | 1.2% |
| Interquartile 25% (IQ1) | 0.86% | 0.99% |
| Interquartile 75% (IQ3) | 2.0% | 1.5% |
| Interquartile Range (IQR) | 1.1% | 0.49% |
| Standard Deviation (Sample) | 1.2% | 1.1% |
| Standard Deviation (Population) | 1.2% | 1.1% |
Similar Demographics by No Schooling Completed
Demographics Similar to Yugoslavians by No Schooling Completed
In terms of no schooling completed, the demographic groups most similar to Yugoslavians are Immigrants from France (1.8%, a difference of 0.040%), Okinawan (1.8%, a difference of 0.22%), German Russian (1.8%, a difference of 0.44%), Thai (1.8%, a difference of 0.46%), and Immigrants from Saudi Arabia (1.9%, a difference of 0.57%).
| Demographics | Rating | Rank | No Schooling Completed |
| Immigrants | Singapore | 98.0 /100 | #100 | Exceptional 1.8% |
| Immigrants | Czechoslovakia | 97.9 /100 | #101 | Exceptional 1.8% |
| Immigrants | Switzerland | 97.9 /100 | #102 | Exceptional 1.8% |
| Basques | 97.9 /100 | #103 | Exceptional 1.8% |
| Thais | 97.5 /100 | #104 | Exceptional 1.8% |
| German Russians | 97.5 /100 | #105 | Exceptional 1.8% |
| Immigrants | France | 97.3 /100 | #106 | Exceptional 1.8% |
| Yugoslavians | 97.2 /100 | #107 | Exceptional 1.8% |
| Okinawans | 97.1 /100 | #108 | Exceptional 1.8% |
| Immigrants | Saudi Arabia | 96.8 /100 | #109 | Exceptional 1.9% |
| Immigrants | Latvia | 96.7 /100 | #110 | Exceptional 1.9% |
| Immigrants | Japan | 96.6 /100 | #111 | Exceptional 1.9% |
| Pueblo | 96.4 /100 | #112 | Exceptional 1.9% |
| Immigrants | Zimbabwe | 96.2 /100 | #113 | Exceptional 1.9% |
| Immigrants | Norway | 96.1 /100 | #114 | Exceptional 1.9% |
Demographics Similar to French Canadians by No Schooling Completed
In terms of no schooling completed, the demographic groups most similar to French Canadians are Scandinavian (1.5%, a difference of 0.010%), Czech (1.5%, a difference of 0.54%), Lumbee (1.5%, a difference of 0.91%), French (1.5%, a difference of 1.1%), and Pennsylvania German (1.5%, a difference of 1.1%).
| Demographics | Rating | Rank | No Schooling Completed |
| Chinese | 100.0 /100 | #21 | Exceptional 1.5% |
| Alaska Natives | 100.0 /100 | #22 | Exceptional 1.5% |
| Europeans | 100.0 /100 | #23 | Exceptional 1.5% |
| Pennsylvania Germans | 100.0 /100 | #24 | Exceptional 1.5% |
| French | 100.0 /100 | #25 | Exceptional 1.5% |
| Czechs | 100.0 /100 | #26 | Exceptional 1.5% |
| Scandinavians | 100.0 /100 | #27 | Exceptional 1.5% |
| French Canadians | 100.0 /100 | #28 | Exceptional 1.5% |
| Lumbee | 100.0 /100 | #29 | Exceptional 1.5% |
| British | 100.0 /100 | #30 | Exceptional 1.5% |
| Inupiat | 100.0 /100 | #31 | Exceptional 1.5% |
| Swiss | 100.0 /100 | #32 | Exceptional 1.5% |
| Italians | 100.0 /100 | #33 | Exceptional 1.5% |
| Latvians | 100.0 /100 | #34 | Exceptional 1.5% |
| Eastern Europeans | 100.0 /100 | #35 | Exceptional 1.6% |