Immigrants from South Central Asia vs Immigrants from Singapore GED/Equivalency

COMPARE

Immigrants from South Central Asia
Race
Ancestry
AfghanAfricanAlaska NativeAlaskan AthabascanAlbanianAleutAlsatianAmericanApacheArabArapahoArgentineanArmenianAssyrian/Chaldean/SyriacAustralianAustrianBahamianBangladeshiBarbadianBasqueBelgianBelizeanBermudanBhutaneseBlackfeetBolivianBrazilianBritishBritish West IndianBulgarianBurmeseCajunCambodianCanadianCape VerdeanCarpatho RusynCelticCentral AmericanCentral American IndianCherokeeCheyenneChickasawChileanChineseChippewaChoctawColombianColvilleComancheCosta RicanCreeCreekCroatianCrowCubanCypriotCzechCzechoslovakianDanishDelawareDominicanDutchDutch West IndianEastern EuropeanEcuadorianEgyptianEnglishEstonianEthiopianEuropeanFijianFilipinoFinnishFrenchFrench American IndianFrench CanadianGermanGerman RussianGhanaianGreekGuamanian/ChamorroGuatemalanGuyaneseHaitianHmongHonduranHopiHoumaHungarianIcelanderIndian (Asian)IndonesianInupiatIranianIraqiIrishIroquoisIsraeliItalianJamaicanJapaneseJordanianKenyanKiowaKoreanLaotianLatvianLebaneseLiberianLithuanianLumbeeLuxembourgerMacedonianMalaysianMalteseMarshalleseMenomineeMexicanMexican American IndianMongolianMoroccanNative HawaiianNavajoNepaleseNew ZealanderNicaraguanNigerianNorthern EuropeanNorwegianOkinawanOsageOttawaPaiutePakistaniPalestinianPanamanianParaguayanPennsylvania GermanPeruvianPimaPolishPortuguesePotawatomiPuebloPuerto RicanPuget Sound SalishRomanianRussianSalvadoranSamoanScandinavianScotch-IrishScottishSeminoleSenegaleseSerbianShoshoneSierra LeoneanSiouxSlavicSlovakSloveneSomaliSouth AfricanSouth AmericanSouth American IndianSoviet UnionSpaniardSpanishSpanish AmericanSpanish American IndianSri LankanSubsaharan AfricanSudaneseSwedishSwissSyrianTaiwaneseThaiTlingit-HaidaTohono O'OdhamTonganTrinidadian and TobagonianTsimshianTurkishU.S. Virgin IslanderUgandanUkrainianUruguayanUteVenezuelanVietnameseWelshWest IndianYakamaYaquiYugoslavianYumanYup'ikZimbabwean
Immigration
NonimmigrantsImmigrantsAfghanistanAfricaAlbaniaArgentinaArmeniaAsiaAustraliaAustriaBahamasBangladeshBarbadosBelarusBelgiumBelizeBoliviaBosnia and HerzegovinaBrazilBulgariaBurma/MyanmarCabo VerdeCambodiaCameroonCanadaCaribbeanCentral AmericaChileChinaColombiaCongoCosta RicaCroatiaCubaCzechoslovakiaDenmarkDominicaDominican RepublicEastern AfricaEastern AsiaEastern EuropeEcuadorEgyptEl SalvadorEnglandEritreaEthiopiaEuropeFijiFranceGermanyGhanaGreeceGrenadaGuatemalaGuyanaHaitiHondurasHong KongHungaryIndiaIndonesiaIranIraqIrelandIsraelItalyJamaicaJapanJordanKazakhstanKenyaKoreaKuwaitLaosLatin AmericaLatviaLebanonLiberiaLithuaniaMalaysiaMexicoMicronesiaMiddle AfricaMoldovaMoroccoNepalNetherlandsNicaraguaNigeriaNorth AmericaNorth MacedoniaNorthern AfricaNorthern EuropeNorwayOceaniaPakistanPanamaPeruPhilippinesPolandPortugalRomaniaRussiaSaudi ArabiaScotlandSenegalSerbiaSierra LeoneSomaliaSouth AfricaSouth AmericaSouth Central AsiaSouth Eastern AsiaSouthern EuropeSpainSri LankaSt. Vincent and the GrenadinesSudanSwedenSwitzerlandSyriaTaiwanThailandTrinidad and TobagoTurkeyUgandaUkraineUruguayUzbekistanVenezuelaVietnamWest IndiesWestern AfricaWestern AsiaWestern EuropeYemenZaireZimbabweAzores
Immigrants from Singapore
Race
Ancestry
AfghanAfricanAlaska NativeAlaskan AthabascanAlbanianAleutAlsatianAmericanApacheArabArapahoArgentineanArmenianAssyrian/Chaldean/SyriacAustralianAustrianBahamianBangladeshiBarbadianBasqueBelgianBelizeanBermudanBhutaneseBlackfeetBolivianBrazilianBritishBritish West IndianBulgarianBurmeseCajunCambodianCanadianCape VerdeanCarpatho RusynCelticCentral AmericanCentral American IndianCherokeeCheyenneChickasawChileanChineseChippewaChoctawColombianColvilleComancheCosta RicanCreeCreekCroatianCrowCubanCypriotCzechCzechoslovakianDanishDelawareDominicanDutchDutch West IndianEastern EuropeanEcuadorianEgyptianEnglishEstonianEthiopianEuropeanFijianFilipinoFinnishFrenchFrench American IndianFrench CanadianGermanGerman RussianGhanaianGreekGuamanian/ChamorroGuatemalanGuyaneseHaitianHmongHonduranHopiHoumaHungarianIcelanderIndian (Asian)IndonesianInupiatIranianIraqiIrishIroquoisIsraeliItalianJamaicanJapaneseJordanianKenyanKiowaKoreanLaotianLatvianLebaneseLiberianLithuanianLumbeeLuxembourgerMacedonianMalaysianMalteseMarshalleseMenomineeMexicanMexican American IndianMongolianMoroccanNative HawaiianNavajoNepaleseNew ZealanderNicaraguanNigerianNorthern EuropeanNorwegianOkinawanOsageOttawaPaiutePakistaniPalestinianPanamanianParaguayanPennsylvania GermanPeruvianPimaPolishPortuguesePotawatomiPuebloPuerto RicanPuget Sound SalishRomanianRussianSalvadoranSamoanScandinavianScotch-IrishScottishSeminoleSenegaleseSerbianShoshoneSierra LeoneanSiouxSlavicSlovakSloveneSomaliSouth AfricanSouth AmericanSouth American IndianSoviet UnionSpaniardSpanishSpanish AmericanSpanish American IndianSri LankanSubsaharan AfricanSudaneseSwedishSwissSyrianTaiwaneseThaiTlingit-HaidaTohono O'OdhamTonganTrinidadian and TobagonianTsimshianTurkishU.S. Virgin IslanderUgandanUkrainianUruguayanUteVenezuelanVietnameseWelshWest IndianYakamaYaquiYugoslavianYumanYup'ikZimbabwean
Immigration
NonimmigrantsImmigrantsAfghanistanAfricaAlbaniaArgentinaArmeniaAsiaAustraliaAustriaBahamasBangladeshBarbadosBelarusBelgiumBelizeBoliviaBosnia and HerzegovinaBrazilBulgariaBurma/MyanmarCabo VerdeCambodiaCameroonCanadaCaribbeanCentral AmericaChileChinaColombiaCongoCosta RicaCroatiaCubaCzechoslovakiaDenmarkDominicaDominican RepublicEastern AfricaEastern AsiaEastern EuropeEcuadorEgyptEl SalvadorEnglandEritreaEthiopiaEuropeFijiFranceGermanyGhanaGreeceGrenadaGuatemalaGuyanaHaitiHondurasHong KongHungaryIndiaIndonesiaIranIraqIrelandIsraelItalyJamaicaJapanJordanKazakhstanKenyaKoreaKuwaitLaosLatin AmericaLatviaLebanonLiberiaLithuaniaMalaysiaMexicoMicronesiaMiddle AfricaMoldovaMoroccoNepalNetherlandsNicaraguaNigeriaNorth AmericaNorth MacedoniaNorthern AfricaNorthern EuropeNorwayOceaniaPakistanPanamaPeruPhilippinesPolandPortugalRomaniaRussiaSaudi ArabiaScotlandSenegalSerbiaSierra LeoneSingaporeSomaliaSouth AfricaSouth AmericaSouth Eastern AsiaSouthern EuropeSpainSri LankaSt. Vincent and the GrenadinesSudanSwedenSwitzerlandSyriaTaiwanThailandTrinidad and TobagoTurkeyUgandaUkraineUruguayUzbekistanVenezuelaVietnamWest IndiesWestern AfricaWestern AsiaWestern EuropeYemenZaireZimbabweAzores
GED/Equivalency
Income
Poverty
Unemployment
Labor Participation
Family Structure
Vehicle Availability
Education Level
Disability

GED/Equivalency Comparison

Immigrants from South Central Asia

Immigrants from Singapore

Exceptional
Exceptional
88.4%
GED/EQUIVALENCY
99.7/ 100
METRIC RATING
35th/ 347
METRIC RANK
89.3%
GED/EQUIVALENCY
100.0/ 100
METRIC RATING
3rd/ 347
METRIC RANK

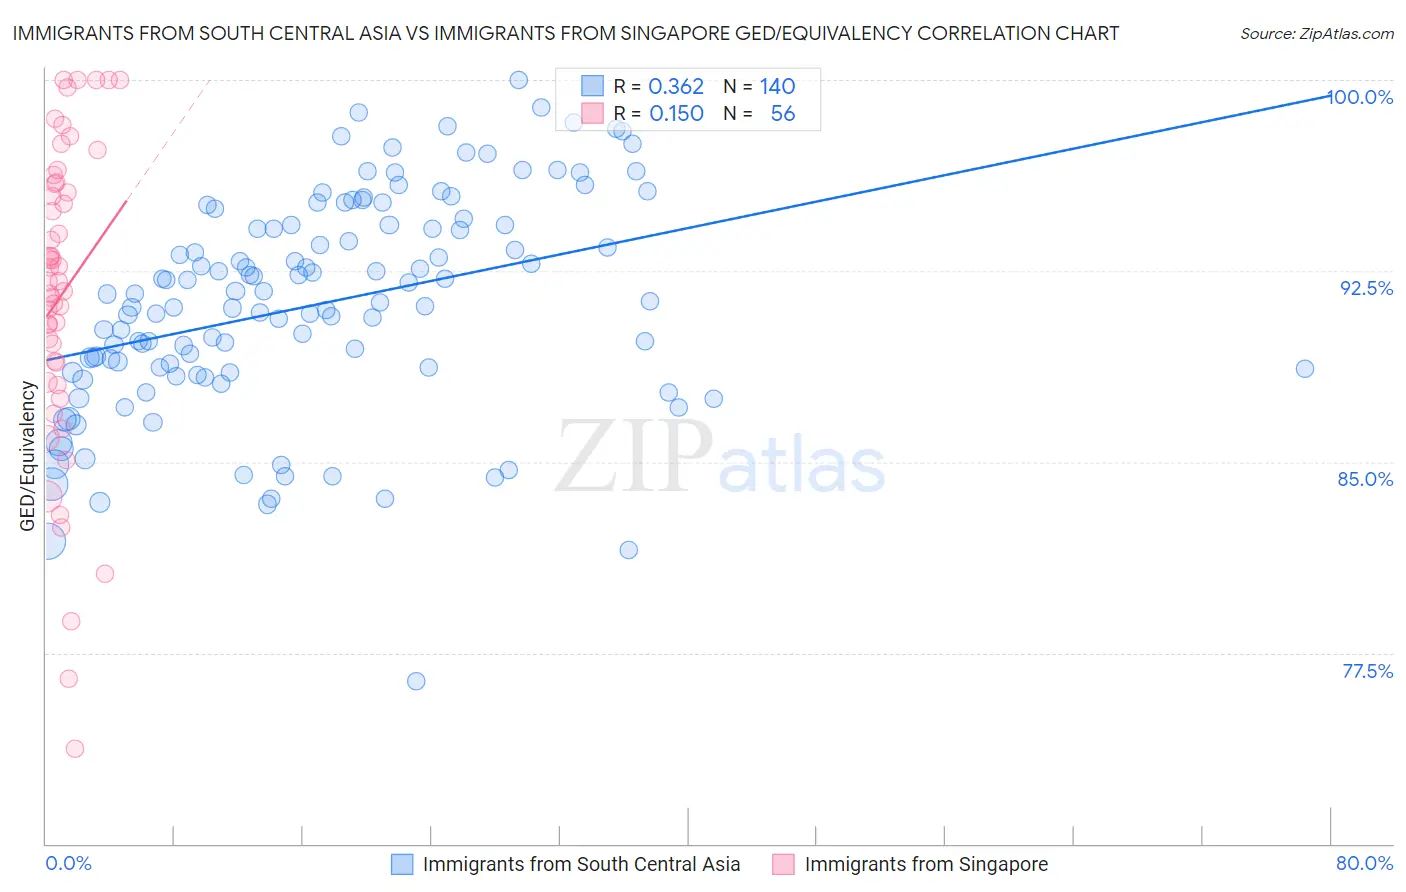
Immigrants from South Central Asia vs Immigrants from Singapore GED/Equivalency Correlation Chart

The statistical analysis conducted on geographies consisting of 473,113,181 people shows a mild positive correlation between the proportion of Immigrants from South Central Asia and percentage of population with at least ged/equivalency education in the United States with a correlation coefficient (R) of 0.362 and weighted average of 88.4%. Similarly, the statistical analysis conducted on geographies consisting of 137,521,094 people shows a poor positive correlation between the proportion of Immigrants from Singapore and percentage of population with at least ged/equivalency education in the United States with a correlation coefficient (R) of 0.150 and weighted average of 89.3%, a difference of 1.1%.
Immigrants from South Central Asia vs Immigrants from Singapore GED/Equivalency

GED/Equivalency Correlation Summary

MeasurementImmigrants from South Central AsiaImmigrants from Singapore
Minimum76.4%73.7%
Maximum100.0%100.0%
Range23.6%26.3%
Mean91.2%91.6%
Median91.3%92.1%
Interquartile 25% (IQ1)88.6%88.5%
Interquartile 75% (IQ3)94.3%95.9%
Interquartile Range (IQR)5.7%7.4%
Standard Deviation (Sample)4.3%6.1%
Standard Deviation (Population)4.2%6.0%

Similar Demographics by GED/Equivalency

Demographics Similar to Immigrants from South Central Asia by GED/Equivalency

In terms of ged/equivalency, the demographic groups most similar to Immigrants from South Central Asia are Immigrants from Sweden (88.4%, a difference of 0.020%), Immigrants from Japan (88.4%, a difference of 0.020%), Immigrants from Belgium (88.3%, a difference of 0.020%), Immigrants from Austria (88.3%, a difference of 0.050%), and Danish (88.4%, a difference of 0.060%).
DemographicsRating | RankGED/Equivalency
Immigrants | Northern Europe
99.8
/100
|
#28
Exceptional
88.5%
Poles
99.8
/100
|
#29
Exceptional
88.5%
Turks
99.8
/100
|
#30
Exceptional
88.5%
Bhutanese
99.8
/100
|
#31
Exceptional
88.4%
Danes
99.8
/100
|
#32
Exceptional
88.4%
Immigrants | Sweden
99.7
/100
|
#33
Exceptional
88.4%
Immigrants | Japan
99.7
/100
|
#34
Exceptional
88.4%
Immigrants | South Central Asia
99.7
/100
|
#35
Exceptional
88.4%
Immigrants | Belgium
99.7
/100
|
#36
Exceptional
88.3%
Immigrants | Austria
99.7
/100
|
#37
Exceptional
88.3%
Burmese
99.7
/100
|
#38
Exceptional
88.3%
Immigrants | Israel
99.6
/100
|
#39
Exceptional
88.2%
Italians
99.6
/100
|
#40
Exceptional
88.2%
Finns
99.6
/100
|
#41
Exceptional
88.2%
Cambodians
99.6
/100
|
#42
Exceptional
88.2%

Demographics Similar to Immigrants from Singapore by GED/Equivalency

In terms of ged/equivalency, the demographic groups most similar to Immigrants from Singapore are Iranian (89.2%, a difference of 0.090%), Latvian (89.2%, a difference of 0.19%), Thai (89.1%, a difference of 0.20%), Filipino (89.5%, a difference of 0.21%), and Eastern European (89.1%, a difference of 0.25%).
DemographicsRating | RankGED/Equivalency
Immigrants | India
100.0
/100
|
#1
Exceptional
89.7%
Filipinos
100.0
/100
|
#2
Exceptional
89.5%
Immigrants | Singapore
100.0
/100
|
#3
Exceptional
89.3%
Iranians
100.0
/100
|
#4
Exceptional
89.2%
Latvians
100.0
/100
|
#5
Exceptional
89.2%
Thais
100.0
/100
|
#6
Exceptional
89.1%
Eastern Europeans
99.9
/100
|
#7
Exceptional
89.1%
Carpatho Rusyns
99.9
/100
|
#8
Exceptional
89.1%
Chinese
99.9
/100
|
#9
Exceptional
89.0%
Norwegians
99.9
/100
|
#10
Exceptional
89.0%
Bulgarians
99.9
/100
|
#11
Exceptional
89.0%
Lithuanians
99.9
/100
|
#12
Exceptional
88.9%
Immigrants | Iran
99.9
/100
|
#13
Exceptional
88.9%
Cypriots
99.9
/100
|
#14
Exceptional
88.9%
Okinawans
99.9
/100
|
#15
Exceptional
88.9%