Immigrants from South Central Asia vs Immigrants from Singapore Householder Income Ages 25 - 44 years
COMPARE
Immigrants from South Central Asia
Immigrants from Singapore
Householder Income Ages 25 - 44 years
Householder Income Ages 25 - 44 years Comparison
Immigrants from South Central Asia
Immigrants from Singapore
$116,626
HOUSEHOLDER INCOME AGES 25 - 44 YEARS
100.0/ 100
METRIC RATING
15th/ 347
METRIC RANK
$124,429
HOUSEHOLDER INCOME AGES 25 - 44 YEARS
100.0/ 100
METRIC RATING
4th/ 347
METRIC RANK
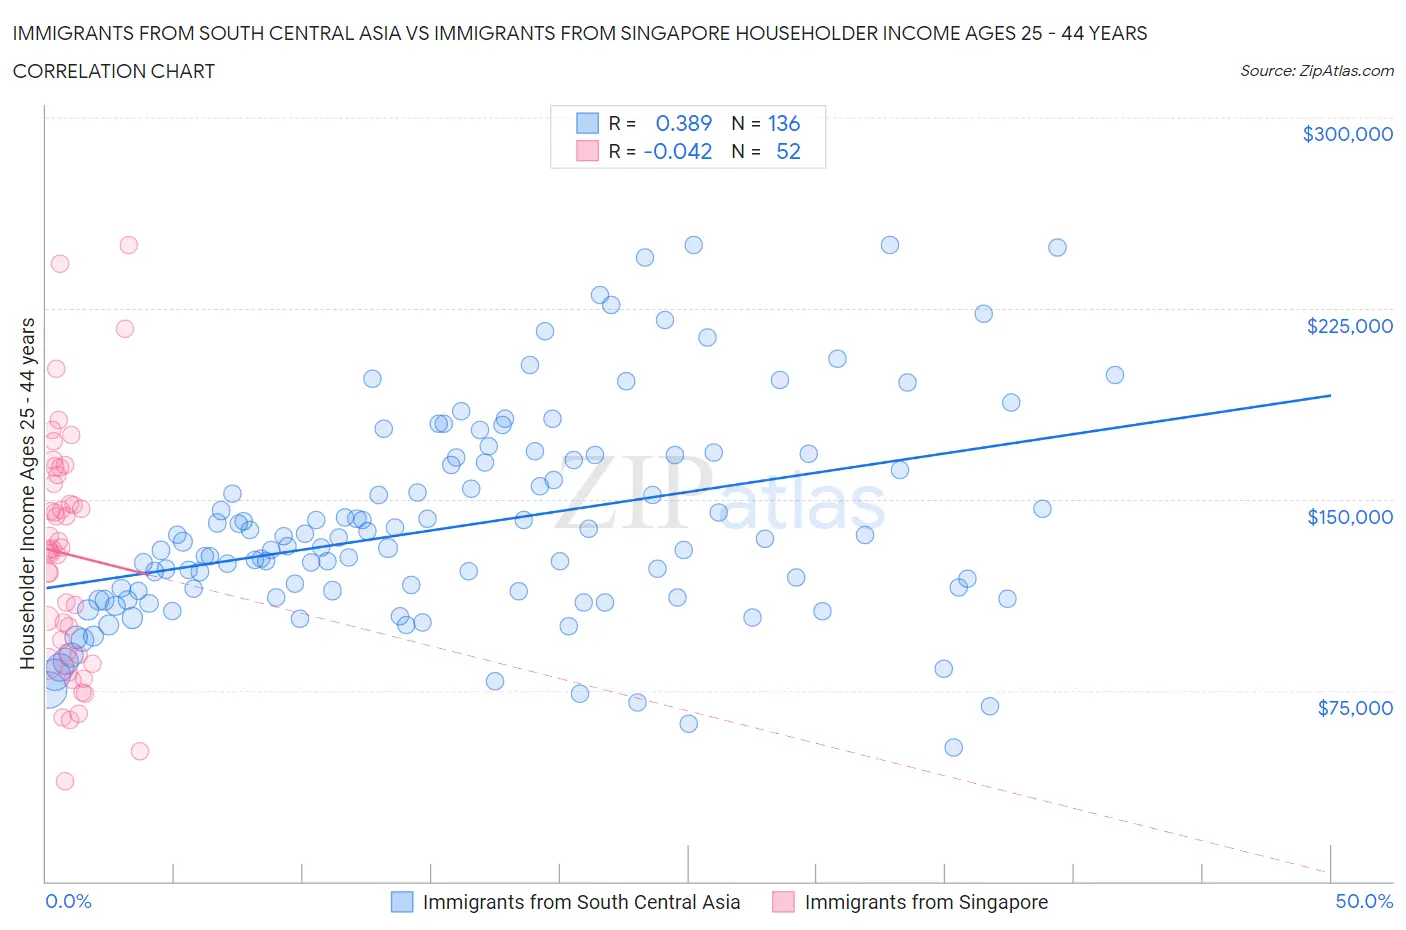
Immigrants from South Central Asia vs Immigrants from Singapore Householder Income Ages 25 - 44 years Correlation Chart
The statistical analysis conducted on geographies consisting of 471,423,947 people shows a mild positive correlation between the proportion of Immigrants from South Central Asia and household income with householder between the ages 25 and 44 in the United States with a correlation coefficient (R) of 0.389 and weighted average of $116,626. Similarly, the statistical analysis conducted on geographies consisting of 137,346,360 people shows no correlation between the proportion of Immigrants from Singapore and household income with householder between the ages 25 and 44 in the United States with a correlation coefficient (R) of -0.042 and weighted average of $124,429, a difference of 6.7%.
Householder Income Ages 25 - 44 years Correlation Summary
| Measurement | Immigrants from South Central Asia | Immigrants from Singapore |
| Minimum | $52,604 | $39,441 |
| Maximum | $250,001 | $250,001 |
| Range | $197,397 | $210,560 |
| Mean | $139,407 | $128,508 |
| Median | $131,527 | $130,454 |
| Interquartile 25% (IQ1) | $111,176 | $89,308 |
| Interquartile 75% (IQ3) | $164,920 | $157,929 |
| Interquartile Range (IQR) | $53,743 | $68,620 |
| Standard Deviation (Sample) | $41,092 | $46,353 |
| Standard Deviation (Population) | $40,940 | $45,905 |
Demographics Similar to Immigrants from South Central Asia and Immigrants from Singapore by Householder Income Ages 25 - 44 years
In terms of householder income ages 25 - 44 years, the demographic groups most similar to Immigrants from South Central Asia are Cypriot ($116,364, a difference of 0.23%), Immigrants from Israel ($117,219, a difference of 0.51%), Immigrants from Australia ($115,947, a difference of 0.59%), Immigrants from Eastern Asia ($118,056, a difference of 1.2%), and Eastern European ($114,523, a difference of 1.8%). Similarly, the demographic groups most similar to Immigrants from Singapore are Immigrants from India ($124,238, a difference of 0.15%), Thai ($121,778, a difference of 2.2%), Immigrants from Hong Kong ($128,140, a difference of 3.0%), Immigrants from Ireland ($120,333, a difference of 3.4%), and Iranian ($120,292, a difference of 3.4%).
| Demographics | Rating | Rank | Householder Income Ages 25 - 44 years |
| Immigrants | Taiwan | 100.0 /100 | #1 | Exceptional $129,122 |
| Filipinos | 100.0 /100 | #2 | Exceptional $128,723 |
| Immigrants | Hong Kong | 100.0 /100 | #3 | Exceptional $128,140 |
| Immigrants | Singapore | 100.0 /100 | #4 | Exceptional $124,429 |
| Immigrants | India | 100.0 /100 | #5 | Exceptional $124,238 |
| Thais | 100.0 /100 | #6 | Exceptional $121,778 |
| Immigrants | Ireland | 100.0 /100 | #7 | Exceptional $120,333 |
| Iranians | 100.0 /100 | #8 | Exceptional $120,292 |
| Immigrants | China | 100.0 /100 | #9 | Exceptional $119,756 |
| Indians (Asian) | 100.0 /100 | #10 | Exceptional $119,496 |
| Okinawans | 100.0 /100 | #11 | Exceptional $119,349 |
| Immigrants | Iran | 100.0 /100 | #12 | Exceptional $119,204 |
| Immigrants | Eastern Asia | 100.0 /100 | #13 | Exceptional $118,056 |
| Immigrants | Israel | 100.0 /100 | #14 | Exceptional $117,219 |
| Immigrants | South Central Asia | 100.0 /100 | #15 | Exceptional $116,626 |
| Cypriots | 100.0 /100 | #16 | Exceptional $116,364 |
| Immigrants | Australia | 100.0 /100 | #17 | Exceptional $115,947 |
| Eastern Europeans | 100.0 /100 | #18 | Exceptional $114,523 |
| Burmese | 100.0 /100 | #19 | Exceptional $113,701 |
| Immigrants | Korea | 100.0 /100 | #20 | Exceptional $113,401 |