Immigrants from South Central Asia vs Immigrants from Moldova 2nd Grade
COMPARE
Immigrants from South Central Asia
Immigrants from Moldova
2nd Grade
2nd Grade Comparison
Immigrants from South Central Asia
Immigrants from Moldova
97.9%
2ND GRADE
68.3/ 100
METRIC RATING
153rd/ 347
METRIC RANK
97.9%
2ND GRADE
72.9/ 100
METRIC RATING
150th/ 347
METRIC RANK
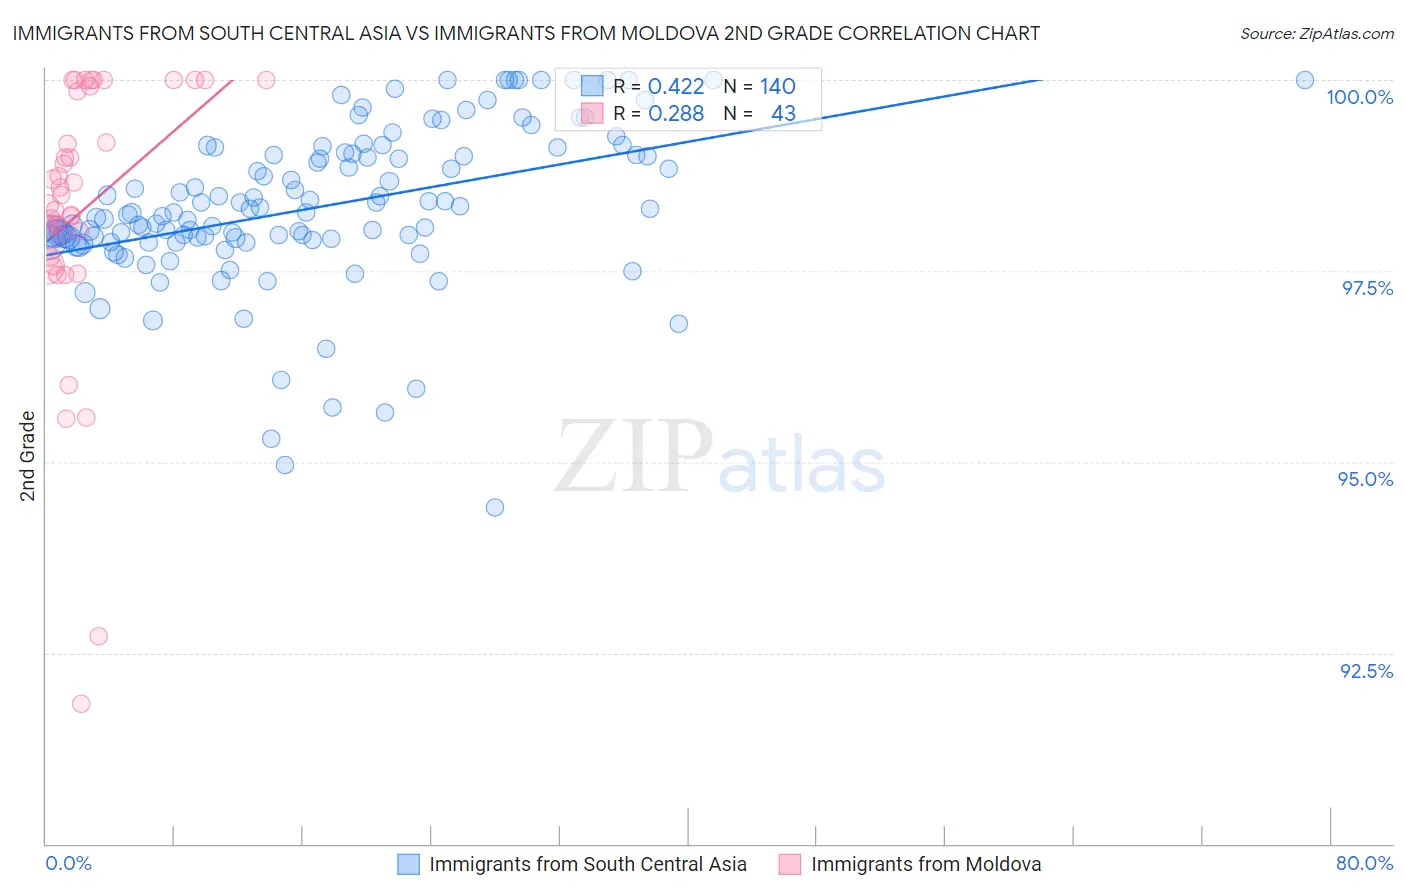
Immigrants from South Central Asia vs Immigrants from Moldova 2nd Grade Correlation Chart
The statistical analysis conducted on geographies consisting of 473,113,181 people shows a moderate positive correlation between the proportion of Immigrants from South Central Asia and percentage of population with at least 2nd grade education in the United States with a correlation coefficient (R) of 0.422 and weighted average of 97.9%. Similarly, the statistical analysis conducted on geographies consisting of 124,398,501 people shows a weak positive correlation between the proportion of Immigrants from Moldova and percentage of population with at least 2nd grade education in the United States with a correlation coefficient (R) of 0.288 and weighted average of 97.9%, a difference of 0.020%.
2nd Grade Correlation Summary
| Measurement | Immigrants from South Central Asia | Immigrants from Moldova |
| Minimum | 94.4% | 91.8% |
| Maximum | 100.0% | 100.0% |
| Range | 5.6% | 8.2% |
| Mean | 98.3% | 98.3% |
| Median | 98.3% | 98.5% |
| Interquartile 25% (IQ1) | 97.9% | 97.7% |
| Interquartile 75% (IQ3) | 99.0% | 99.9% |
| Interquartile Range (IQR) | 1.1% | 2.2% |
| Standard Deviation (Sample) | 1.0% | 1.8% |
| Standard Deviation (Population) | 1.0% | 1.8% |
Demographics Similar to Immigrants from South Central Asia and Immigrants from Moldova by 2nd Grade
In terms of 2nd grade, the demographic groups most similar to Immigrants from South Central Asia are Immigrants from North Macedonia (97.9%, a difference of 0.0%), Marshallese (97.9%, a difference of 0.0%), Soviet Union (97.9%, a difference of 0.010%), French American Indian (97.9%, a difference of 0.010%), and Jordanian (98.0%, a difference of 0.020%). Similarly, the demographic groups most similar to Immigrants from Moldova are Apache (97.9%, a difference of 0.0%), Jordanian (98.0%, a difference of 0.010%), Soviet Union (97.9%, a difference of 0.010%), Immigrants from Israel (98.0%, a difference of 0.020%), and Immigrants from Greece (98.0%, a difference of 0.020%).
| Demographics | Rating | Rank | 2nd Grade |
| Immigrants | Turkey | 83.0 /100 | #141 | Excellent 98.0% |
| Burmese | 81.0 /100 | #142 | Excellent 98.0% |
| Alsatians | 80.5 /100 | #143 | Excellent 98.0% |
| Hmong | 80.0 /100 | #144 | Good 98.0% |
| Filipinos | 79.2 /100 | #145 | Good 98.0% |
| Immigrants | Israel | 78.0 /100 | #146 | Good 98.0% |
| Immigrants | Greece | 76.8 /100 | #147 | Good 98.0% |
| Jordanians | 74.5 /100 | #148 | Good 98.0% |
| Apache | 74.0 /100 | #149 | Good 97.9% |
| Immigrants | Moldova | 72.9 /100 | #150 | Good 97.9% |
| Soviet Union | 70.7 /100 | #151 | Good 97.9% |
| Immigrants | North Macedonia | 68.5 /100 | #152 | Good 97.9% |
| Immigrants | South Central Asia | 68.3 /100 | #153 | Good 97.9% |
| Marshallese | 67.7 /100 | #154 | Good 97.9% |
| French American Indians | 64.3 /100 | #155 | Good 97.9% |
| Dutch West Indians | 63.8 /100 | #156 | Good 97.9% |
| Venezuelans | 63.3 /100 | #157 | Good 97.9% |
| Immigrants | Iran | 62.8 /100 | #158 | Good 97.9% |
| Comanche | 62.8 /100 | #159 | Good 97.9% |
| Immigrants | Eastern Europe | 61.1 /100 | #160 | Good 97.9% |
| Immigrants | Russia | 60.3 /100 | #161 | Good 97.9% |