Immigrants from South Central Asia vs Belgian 2nd Grade
COMPARE
Immigrants from South Central Asia
Belgian
2nd Grade
2nd Grade Comparison
Immigrants from South Central Asia
Belgians
97.9%
2ND GRADE
68.3/ 100
METRIC RATING
153rd/ 347
METRIC RANK
98.4%
2ND GRADE
99.9/ 100
METRIC RATING
43rd/ 347
METRIC RANK
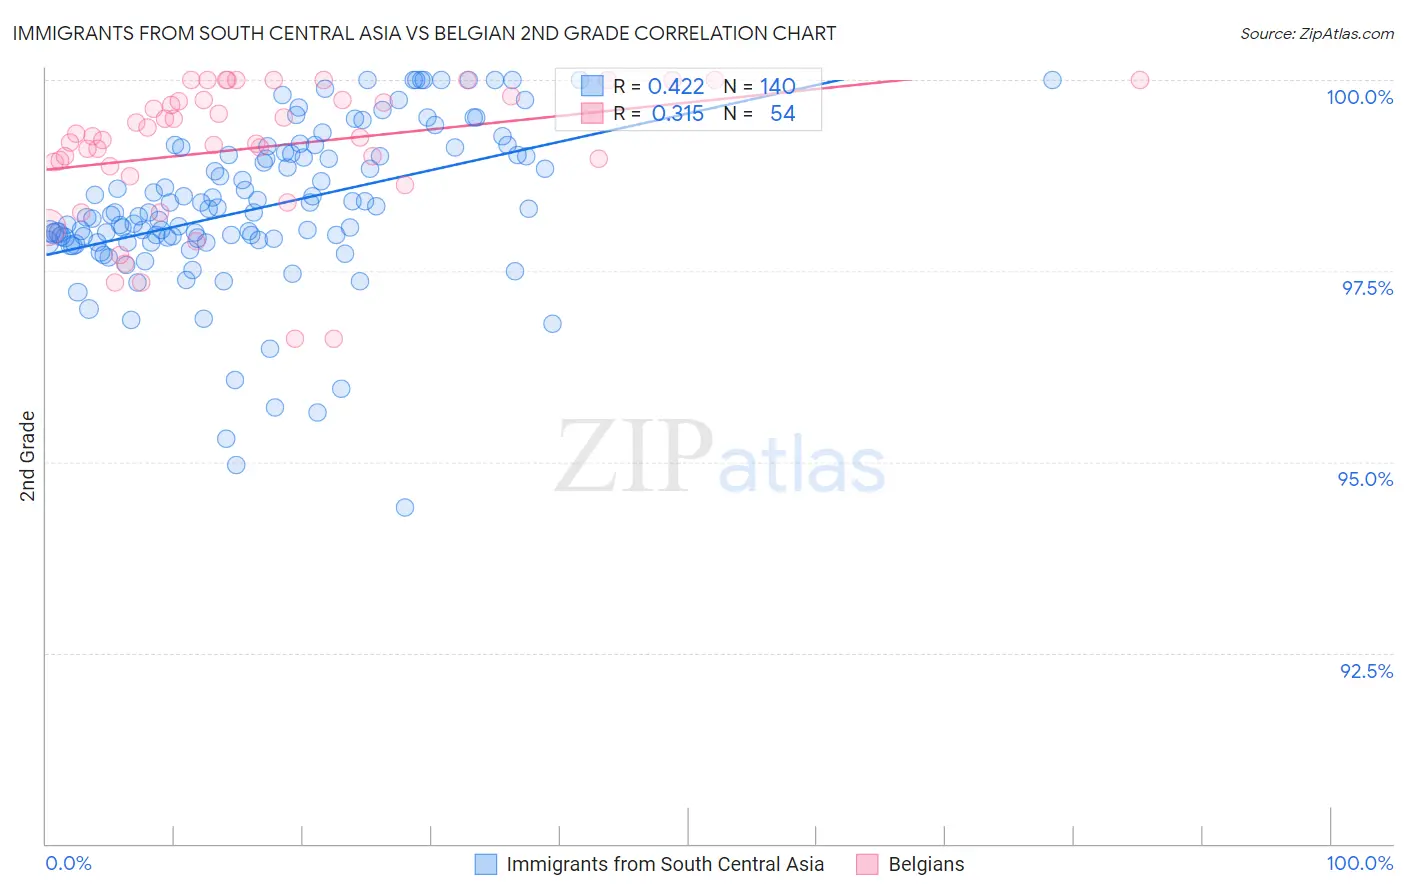
Immigrants from South Central Asia vs Belgian 2nd Grade Correlation Chart
The statistical analysis conducted on geographies consisting of 473,113,181 people shows a moderate positive correlation between the proportion of Immigrants from South Central Asia and percentage of population with at least 2nd grade education in the United States with a correlation coefficient (R) of 0.422 and weighted average of 97.9%. Similarly, the statistical analysis conducted on geographies consisting of 356,016,627 people shows a mild positive correlation between the proportion of Belgians and percentage of population with at least 2nd grade education in the United States with a correlation coefficient (R) of 0.315 and weighted average of 98.4%, a difference of 0.50%.
2nd Grade Correlation Summary
| Measurement | Immigrants from South Central Asia | Belgian |
| Minimum | 94.4% | 96.6% |
| Maximum | 100.0% | 100.0% |
| Range | 5.6% | 3.4% |
| Mean | 98.3% | 99.1% |
| Median | 98.3% | 99.3% |
| Interquartile 25% (IQ1) | 97.9% | 98.9% |
| Interquartile 75% (IQ3) | 99.0% | 99.7% |
| Interquartile Range (IQR) | 1.1% | 0.87% |
| Standard Deviation (Sample) | 1.0% | 0.88% |
| Standard Deviation (Population) | 1.0% | 0.87% |
Similar Demographics by 2nd Grade
Demographics Similar to Immigrants from South Central Asia by 2nd Grade
In terms of 2nd grade, the demographic groups most similar to Immigrants from South Central Asia are Immigrants from North Macedonia (97.9%, a difference of 0.0%), Marshallese (97.9%, a difference of 0.0%), Soviet Union (97.9%, a difference of 0.010%), French American Indian (97.9%, a difference of 0.010%), and Jordanian (98.0%, a difference of 0.020%).
| Demographics | Rating | Rank | 2nd Grade |
| Immigrants | Israel | 78.0 /100 | #146 | Good 98.0% |
| Immigrants | Greece | 76.8 /100 | #147 | Good 98.0% |
| Jordanians | 74.5 /100 | #148 | Good 98.0% |
| Apache | 74.0 /100 | #149 | Good 97.9% |
| Immigrants | Moldova | 72.9 /100 | #150 | Good 97.9% |
| Soviet Union | 70.7 /100 | #151 | Good 97.9% |
| Immigrants | North Macedonia | 68.5 /100 | #152 | Good 97.9% |
| Immigrants | South Central Asia | 68.3 /100 | #153 | Good 97.9% |
| Marshallese | 67.7 /100 | #154 | Good 97.9% |
| French American Indians | 64.3 /100 | #155 | Good 97.9% |
| Dutch West Indians | 63.8 /100 | #156 | Good 97.9% |
| Venezuelans | 63.3 /100 | #157 | Good 97.9% |
| Immigrants | Iran | 62.8 /100 | #158 | Good 97.9% |
| Comanche | 62.8 /100 | #159 | Good 97.9% |
| Immigrants | Eastern Europe | 61.1 /100 | #160 | Good 97.9% |
Demographics Similar to Belgians by 2nd Grade
In terms of 2nd grade, the demographic groups most similar to Belgians are Native Hawaiian (98.4%, a difference of 0.0%), Northern European (98.4%, a difference of 0.0%), Eastern European (98.4%, a difference of 0.010%), Latvian (98.4%, a difference of 0.020%), and Chippewa (98.4%, a difference of 0.020%).
| Demographics | Rating | Rank | 2nd Grade |
| British | 100.0 /100 | #36 | Exceptional 98.5% |
| Italians | 99.9 /100 | #37 | Exceptional 98.4% |
| Latvians | 99.9 /100 | #38 | Exceptional 98.4% |
| Chippewa | 99.9 /100 | #39 | Exceptional 98.4% |
| Luxembourgers | 99.9 /100 | #40 | Exceptional 98.4% |
| Eastern Europeans | 99.9 /100 | #41 | Exceptional 98.4% |
| Native Hawaiians | 99.9 /100 | #42 | Exceptional 98.4% |
| Belgians | 99.9 /100 | #43 | Exceptional 98.4% |
| Northern Europeans | 99.9 /100 | #44 | Exceptional 98.4% |
| Hungarians | 99.9 /100 | #45 | Exceptional 98.4% |
| Lumbee | 99.9 /100 | #46 | Exceptional 98.4% |
| Ottawa | 99.9 /100 | #47 | Exceptional 98.4% |
| Czechoslovakians | 99.9 /100 | #48 | Exceptional 98.4% |
| Celtics | 99.8 /100 | #49 | Exceptional 98.4% |
| Whites/Caucasians | 99.8 /100 | #50 | Exceptional 98.4% |