Immigrants from Hungary vs Immigrants from Moldova 2nd Grade
COMPARE
Immigrants from Hungary
Immigrants from Moldova
2nd Grade
2nd Grade Comparison
Immigrants from Hungary
Immigrants from Moldova
98.0%
2ND GRADE
89.7/ 100
METRIC RATING
134th/ 347
METRIC RANK
97.9%
2ND GRADE
72.9/ 100
METRIC RATING
150th/ 347
METRIC RANK
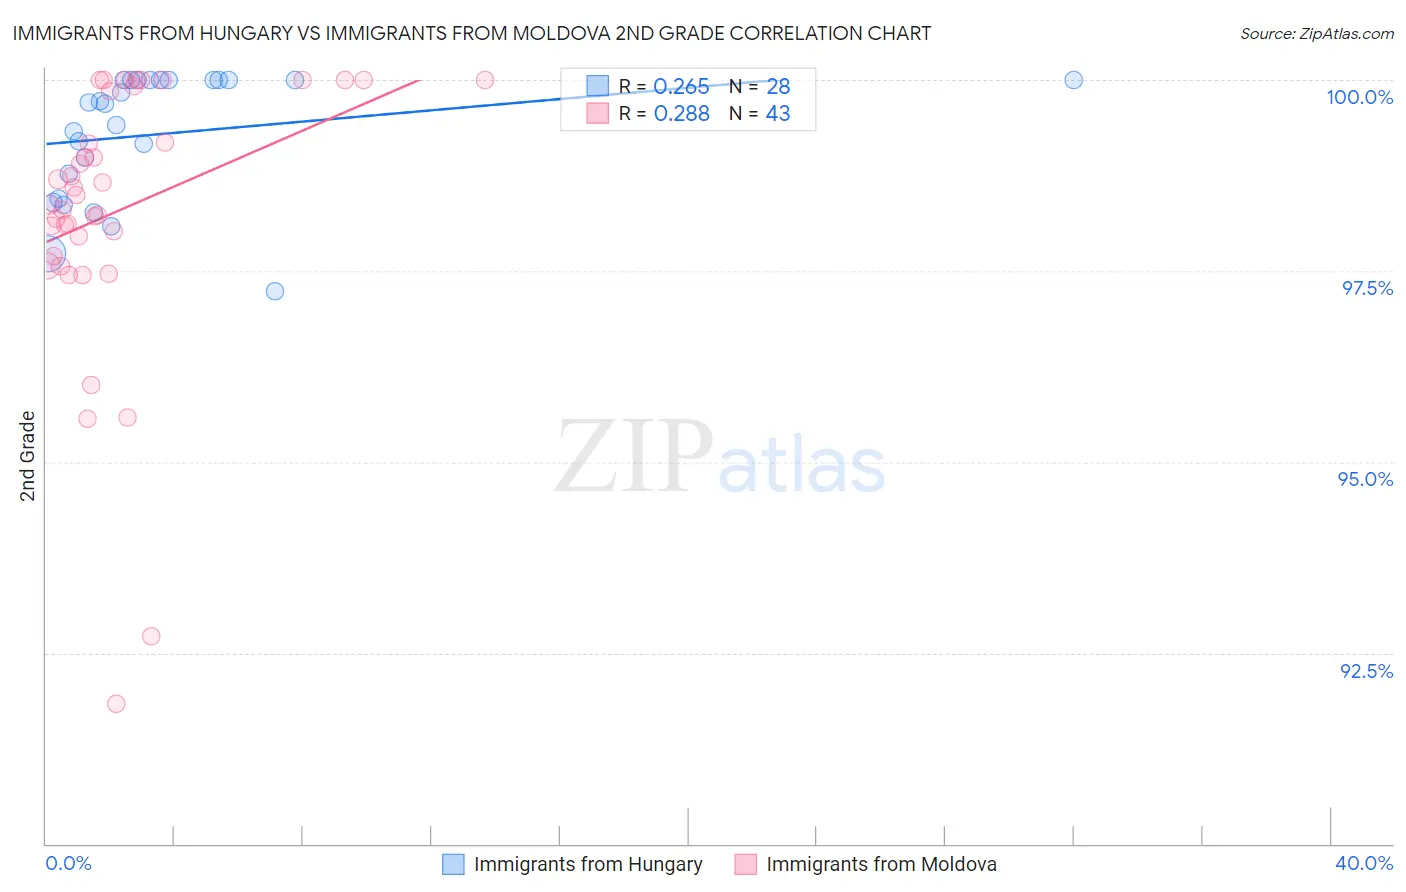
Immigrants from Hungary vs Immigrants from Moldova 2nd Grade Correlation Chart
The statistical analysis conducted on geographies consisting of 195,707,305 people shows a weak positive correlation between the proportion of Immigrants from Hungary and percentage of population with at least 2nd grade education in the United States with a correlation coefficient (R) of 0.265 and weighted average of 98.0%. Similarly, the statistical analysis conducted on geographies consisting of 124,398,501 people shows a weak positive correlation between the proportion of Immigrants from Moldova and percentage of population with at least 2nd grade education in the United States with a correlation coefficient (R) of 0.288 and weighted average of 97.9%, a difference of 0.090%.
2nd Grade Correlation Summary
| Measurement | Immigrants from Hungary | Immigrants from Moldova |
| Minimum | 97.2% | 91.8% |
| Maximum | 100.0% | 100.0% |
| Range | 2.8% | 8.2% |
| Mean | 99.3% | 98.3% |
| Median | 99.7% | 98.5% |
| Interquartile 25% (IQ1) | 98.6% | 97.7% |
| Interquartile 75% (IQ3) | 100.0% | 99.9% |
| Interquartile Range (IQR) | 1.4% | 2.2% |
| Standard Deviation (Sample) | 0.82% | 1.8% |
| Standard Deviation (Population) | 0.81% | 1.8% |
Demographics Similar to Immigrants from Hungary and Immigrants from Moldova by 2nd Grade
In terms of 2nd grade, the demographic groups most similar to Immigrants from Hungary are Immigrants from Bulgaria (98.0%, a difference of 0.0%), Immigrants from Kuwait (98.0%, a difference of 0.0%), Spaniard (98.0%, a difference of 0.010%), Cambodian (98.0%, a difference of 0.010%), and Immigrants from Romania (98.0%, a difference of 0.010%). Similarly, the demographic groups most similar to Immigrants from Moldova are Apache (97.9%, a difference of 0.0%), Jordanian (98.0%, a difference of 0.010%), Soviet Union (97.9%, a difference of 0.010%), Immigrants from Israel (98.0%, a difference of 0.020%), and Immigrants from Greece (98.0%, a difference of 0.020%).
| Demographics | Rating | Rank | 2nd Grade |
| Spaniards | 90.7 /100 | #132 | Exceptional 98.0% |
| Cambodians | 90.7 /100 | #133 | Exceptional 98.0% |
| Immigrants | Hungary | 89.7 /100 | #134 | Excellent 98.0% |
| Immigrants | Bulgaria | 89.7 /100 | #135 | Excellent 98.0% |
| Immigrants | Kuwait | 89.2 /100 | #136 | Excellent 98.0% |
| Immigrants | Romania | 88.3 /100 | #137 | Excellent 98.0% |
| Israelis | 87.9 /100 | #138 | Excellent 98.0% |
| Blackfeet | 87.5 /100 | #139 | Excellent 98.0% |
| Palestinians | 83.9 /100 | #140 | Excellent 98.0% |
| Immigrants | Turkey | 83.0 /100 | #141 | Excellent 98.0% |
| Burmese | 81.0 /100 | #142 | Excellent 98.0% |
| Alsatians | 80.5 /100 | #143 | Excellent 98.0% |
| Hmong | 80.0 /100 | #144 | Good 98.0% |
| Filipinos | 79.2 /100 | #145 | Good 98.0% |
| Immigrants | Israel | 78.0 /100 | #146 | Good 98.0% |
| Immigrants | Greece | 76.8 /100 | #147 | Good 98.0% |
| Jordanians | 74.5 /100 | #148 | Good 98.0% |
| Apache | 74.0 /100 | #149 | Good 97.9% |
| Immigrants | Moldova | 72.9 /100 | #150 | Good 97.9% |
| Soviet Union | 70.7 /100 | #151 | Good 97.9% |
| Immigrants | North Macedonia | 68.5 /100 | #152 | Good 97.9% |