Immigrants from South Central Asia vs Kenyan 2nd Grade
COMPARE
Immigrants from South Central Asia
Kenyan
2nd Grade
2nd Grade Comparison
Immigrants from South Central Asia
Kenyans
97.9%
2ND GRADE
68.3/ 100
METRIC RATING
153rd/ 347
METRIC RANK
97.9%
2ND GRADE
52.7/ 100
METRIC RATING
173rd/ 347
METRIC RANK
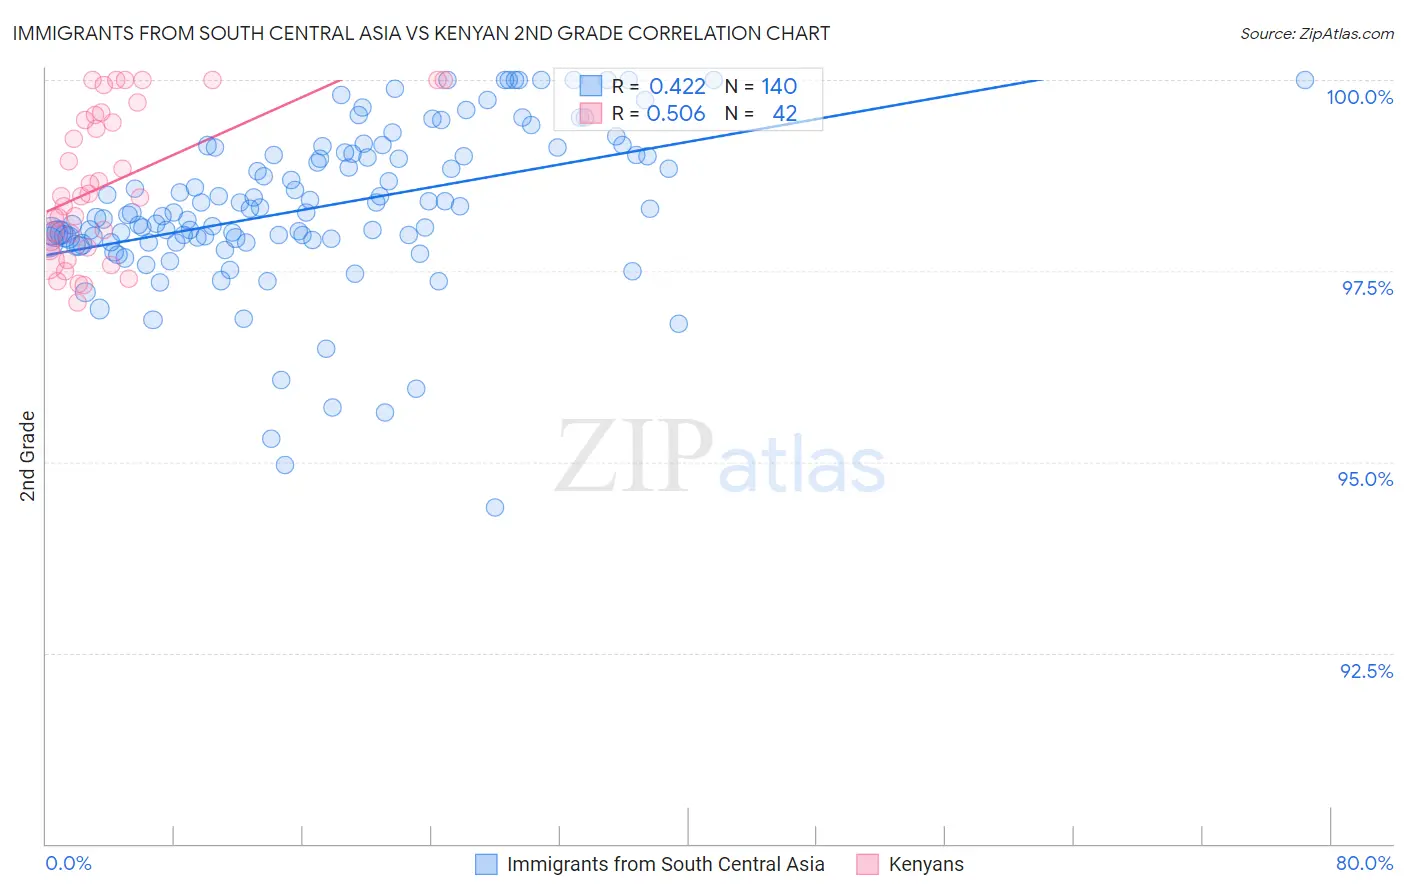
Immigrants from South Central Asia vs Kenyan 2nd Grade Correlation Chart
The statistical analysis conducted on geographies consisting of 473,113,181 people shows a moderate positive correlation between the proportion of Immigrants from South Central Asia and percentage of population with at least 2nd grade education in the United States with a correlation coefficient (R) of 0.422 and weighted average of 97.9%. Similarly, the statistical analysis conducted on geographies consisting of 168,244,481 people shows a substantial positive correlation between the proportion of Kenyans and percentage of population with at least 2nd grade education in the United States with a correlation coefficient (R) of 0.506 and weighted average of 97.9%, a difference of 0.050%.
2nd Grade Correlation Summary
| Measurement | Immigrants from South Central Asia | Kenyan |
| Minimum | 94.4% | 97.1% |
| Maximum | 100.0% | 100.0% |
| Range | 5.6% | 2.9% |
| Mean | 98.3% | 98.6% |
| Median | 98.3% | 98.5% |
| Interquartile 25% (IQ1) | 97.9% | 97.8% |
| Interquartile 75% (IQ3) | 99.0% | 99.5% |
| Interquartile Range (IQR) | 1.1% | 1.7% |
| Standard Deviation (Sample) | 1.0% | 0.95% |
| Standard Deviation (Population) | 1.0% | 0.94% |
Demographics Similar to Immigrants from South Central Asia and Kenyans by 2nd Grade
In terms of 2nd grade, the demographic groups most similar to Immigrants from South Central Asia are Marshallese (97.9%, a difference of 0.0%), French American Indian (97.9%, a difference of 0.010%), Dutch West Indian (97.9%, a difference of 0.020%), Venezuelan (97.9%, a difference of 0.020%), and Immigrants from Iran (97.9%, a difference of 0.020%). Similarly, the demographic groups most similar to Kenyans are Albanian (97.9%, a difference of 0.0%), Immigrants from Korea (97.9%, a difference of 0.0%), Ugandan (97.9%, a difference of 0.010%), Spanish American (97.9%, a difference of 0.010%), and Immigrants from Jordan (97.9%, a difference of 0.010%).
| Demographics | Rating | Rank | 2nd Grade |
| Immigrants | South Central Asia | 68.3 /100 | #153 | Good 97.9% |
| Marshallese | 67.7 /100 | #154 | Good 97.9% |
| French American Indians | 64.3 /100 | #155 | Good 97.9% |
| Dutch West Indians | 63.8 /100 | #156 | Good 97.9% |
| Venezuelans | 63.3 /100 | #157 | Good 97.9% |
| Immigrants | Iran | 62.8 /100 | #158 | Good 97.9% |
| Comanche | 62.8 /100 | #159 | Good 97.9% |
| Immigrants | Eastern Europe | 61.1 /100 | #160 | Good 97.9% |
| Immigrants | Russia | 60.3 /100 | #161 | Good 97.9% |
| Immigrants | Italy | 60.2 /100 | #162 | Good 97.9% |
| Bermudans | 59.4 /100 | #163 | Average 97.9% |
| Ugandans | 56.6 /100 | #164 | Average 97.9% |
| Spanish Americans | 56.4 /100 | #165 | Average 97.9% |
| Immigrants | Jordan | 56.3 /100 | #166 | Average 97.9% |
| Chileans | 56.1 /100 | #167 | Average 97.9% |
| Brazilians | 55.8 /100 | #168 | Average 97.9% |
| Immigrants | Spain | 55.4 /100 | #169 | Average 97.9% |
| Navajo | 54.3 /100 | #170 | Average 97.9% |
| Albanians | 52.8 /100 | #171 | Average 97.9% |
| Immigrants | Korea | 52.7 /100 | #172 | Average 97.9% |
| Kenyans | 52.7 /100 | #173 | Average 97.9% |