Immigrants from South America vs Cuban Bachelor's Degree
COMPARE
Immigrants from South America
Cuban
Bachelor's Degree
Bachelor's Degree Comparison
Immigrants from South America
Cubans
38.6%
BACHELOR'S DEGREE
70.1/ 100
METRIC RATING
157th/ 347
METRIC RANK
32.5%
BACHELOR'S DEGREE
0.3/ 100
METRIC RATING
267th/ 347
METRIC RANK
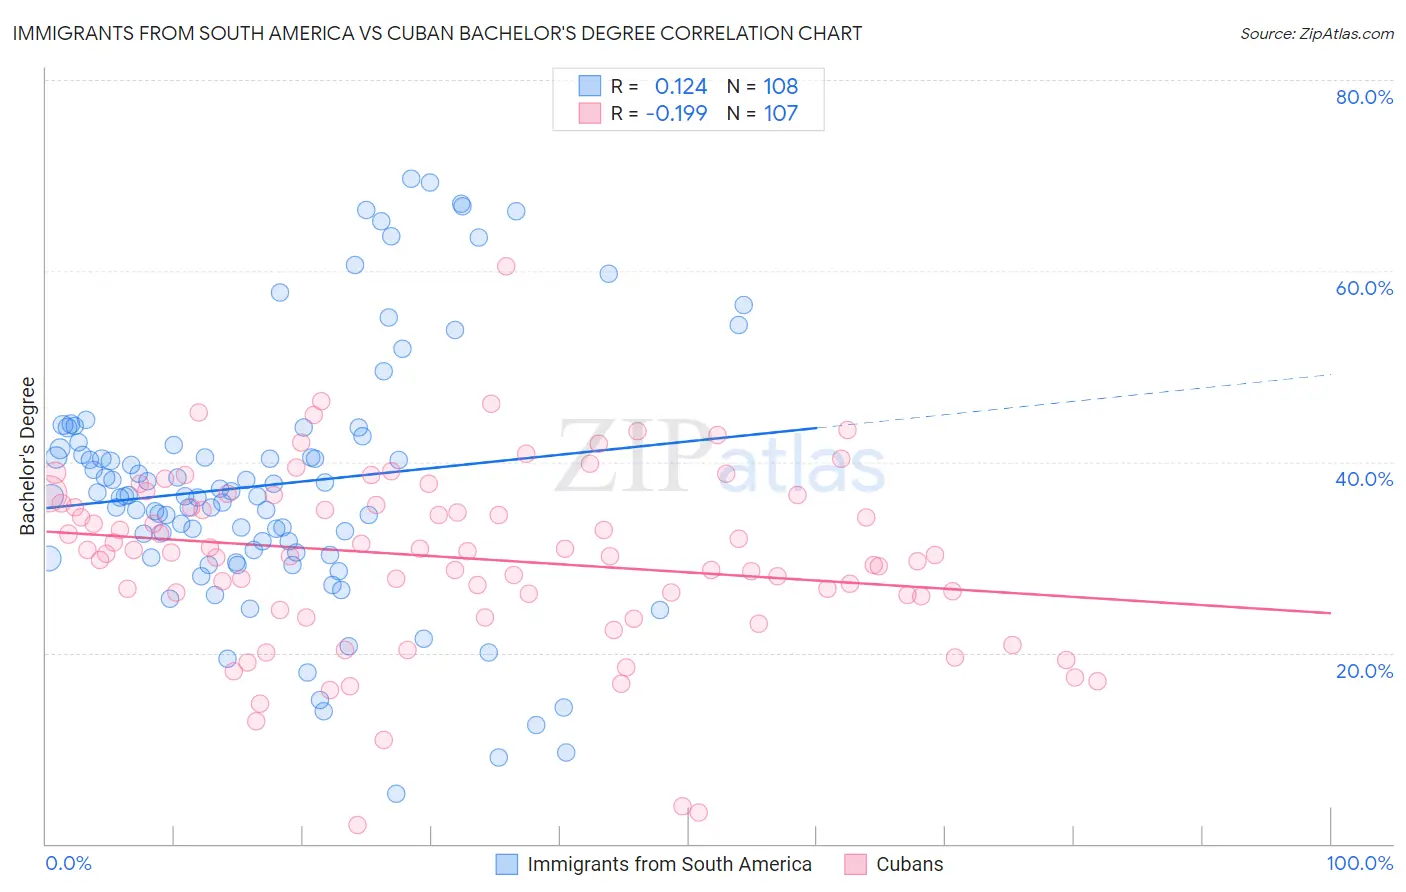
Immigrants from South America vs Cuban Bachelor's Degree Correlation Chart
The statistical analysis conducted on geographies consisting of 486,368,890 people shows a poor positive correlation between the proportion of Immigrants from South America and percentage of population with at least bachelor's degree education in the United States with a correlation coefficient (R) of 0.124 and weighted average of 38.6%. Similarly, the statistical analysis conducted on geographies consisting of 449,220,145 people shows a poor negative correlation between the proportion of Cubans and percentage of population with at least bachelor's degree education in the United States with a correlation coefficient (R) of -0.199 and weighted average of 32.5%, a difference of 18.9%.
Bachelor's Degree Correlation Summary
| Measurement | Immigrants from South America | Cuban |
| Minimum | 5.3% | 2.0% |
| Maximum | 69.7% | 60.5% |
| Range | 64.4% | 58.5% |
| Mean | 37.6% | 30.0% |
| Median | 36.4% | 30.6% |
| Interquartile 25% (IQ1) | 30.4% | 25.9% |
| Interquartile 75% (IQ3) | 41.9% | 36.5% |
| Interquartile Range (IQR) | 11.5% | 10.6% |
| Standard Deviation (Sample) | 13.4% | 9.5% |
| Standard Deviation (Population) | 13.4% | 9.5% |
Similar Demographics by Bachelor's Degree
Demographics Similar to Immigrants from South America by Bachelor's Degree
In terms of bachelor's degree, the demographic groups most similar to Immigrants from South America are Immigrants from Germany (38.6%, a difference of 0.060%), Kenyan (38.7%, a difference of 0.28%), Chinese (38.5%, a difference of 0.39%), Vietnamese (38.5%, a difference of 0.39%), and Immigrants from Kenya (38.8%, a difference of 0.43%).
| Demographics | Rating | Rank | Bachelor's Degree |
| South Americans | 77.3 /100 | #150 | Good 38.9% |
| Immigrants | Africa | 76.5 /100 | #151 | Good 38.9% |
| Sudanese | 76.4 /100 | #152 | Good 38.9% |
| Slavs | 75.9 /100 | #153 | Good 38.9% |
| Canadians | 75.0 /100 | #154 | Good 38.8% |
| Immigrants | Kenya | 73.8 /100 | #155 | Good 38.8% |
| Kenyans | 72.5 /100 | #156 | Good 38.7% |
| Immigrants | South America | 70.1 /100 | #157 | Good 38.6% |
| Immigrants | Germany | 69.6 /100 | #158 | Good 38.6% |
| Chinese | 66.6 /100 | #159 | Good 38.5% |
| Vietnamese | 66.6 /100 | #160 | Good 38.5% |
| Uruguayans | 65.8 /100 | #161 | Good 38.4% |
| Colombians | 65.0 /100 | #162 | Good 38.4% |
| Peruvians | 63.4 /100 | #163 | Good 38.3% |
| Hungarians | 62.1 /100 | #164 | Good 38.3% |
Demographics Similar to Cubans by Bachelor's Degree
In terms of bachelor's degree, the demographic groups most similar to Cubans are Immigrants from Dominica (32.5%, a difference of 0.12%), Bahamian (32.5%, a difference of 0.15%), Central American Indian (32.5%, a difference of 0.18%), Immigrants from Portugal (32.2%, a difference of 0.76%), and Belizean (32.8%, a difference of 0.96%).
| Demographics | Rating | Rank | Bachelor's Degree |
| Malaysians | 0.5 /100 | #260 | Tragic 32.9% |
| Africans | 0.5 /100 | #261 | Tragic 32.9% |
| Immigrants | Jamaica | 0.5 /100 | #262 | Tragic 32.9% |
| Belizeans | 0.4 /100 | #263 | Tragic 32.8% |
| Central American Indians | 0.3 /100 | #264 | Tragic 32.5% |
| Bahamians | 0.3 /100 | #265 | Tragic 32.5% |
| Immigrants | Dominica | 0.3 /100 | #266 | Tragic 32.5% |
| Cubans | 0.3 /100 | #267 | Tragic 32.5% |
| Immigrants | Portugal | 0.2 /100 | #268 | Tragic 32.2% |
| Immigrants | Belize | 0.2 /100 | #269 | Tragic 32.1% |
| Immigrants | Nicaragua | 0.2 /100 | #270 | Tragic 31.9% |
| Central Americans | 0.2 /100 | #271 | Tragic 31.9% |
| Comanche | 0.2 /100 | #272 | Tragic 31.9% |
| Americans | 0.2 /100 | #273 | Tragic 31.9% |
| Potawatomi | 0.2 /100 | #274 | Tragic 31.9% |