Immigrants from South America vs Immigrants from Uruguay Bachelor's Degree
COMPARE
Immigrants from South America
Immigrants from Uruguay
Bachelor's Degree
Bachelor's Degree Comparison
Immigrants from South America
Immigrants from Uruguay
38.6%
BACHELOR'S DEGREE
70.1/ 100
METRIC RATING
157th/ 347
METRIC RANK
37.8%
BACHELOR'S DEGREE
48.3/ 100
METRIC RATING
175th/ 347
METRIC RANK
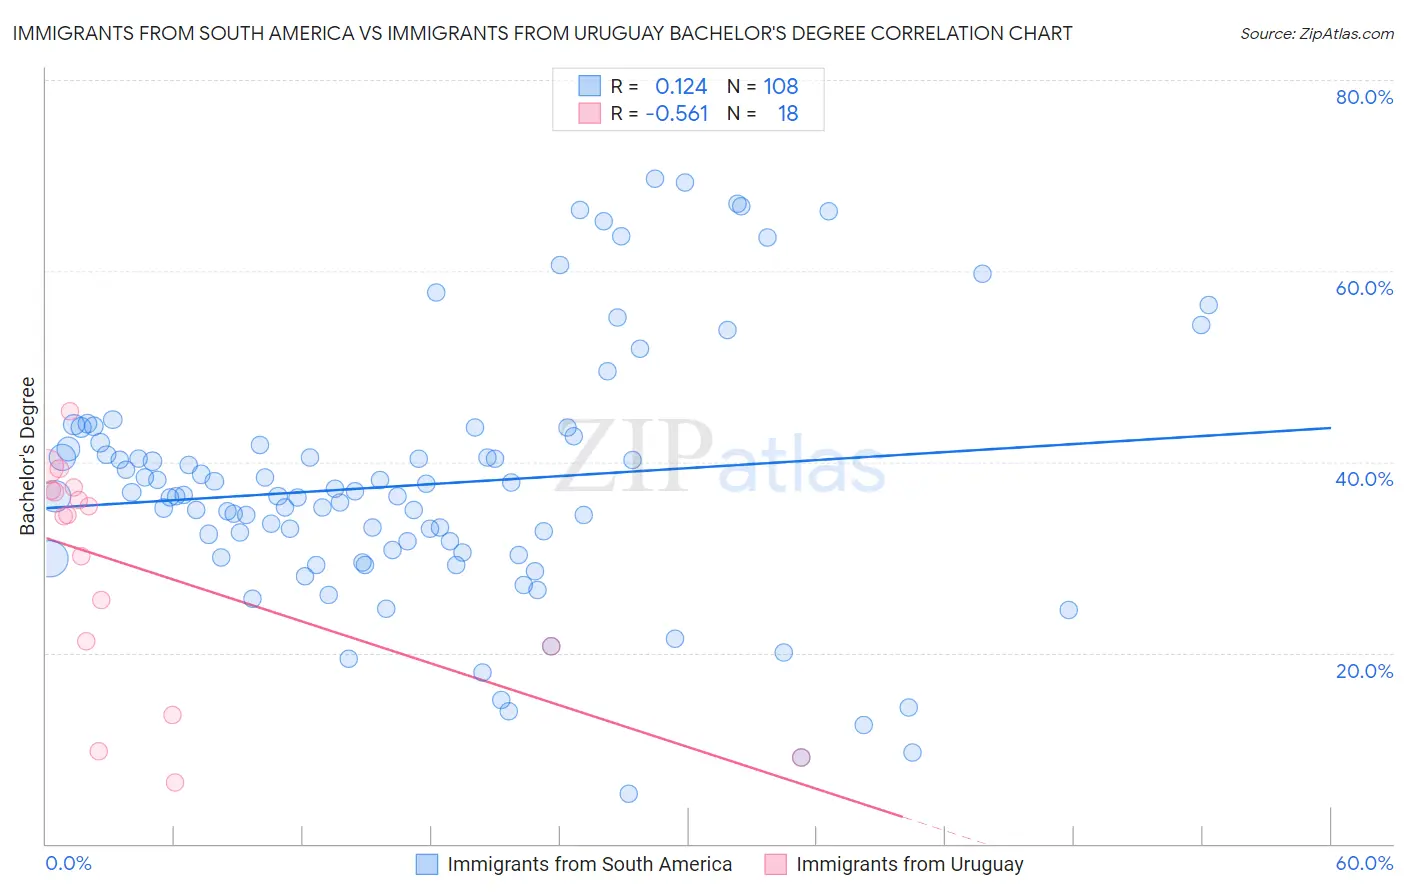
Immigrants from South America vs Immigrants from Uruguay Bachelor's Degree Correlation Chart
The statistical analysis conducted on geographies consisting of 486,368,890 people shows a poor positive correlation between the proportion of Immigrants from South America and percentage of population with at least bachelor's degree education in the United States with a correlation coefficient (R) of 0.124 and weighted average of 38.6%. Similarly, the statistical analysis conducted on geographies consisting of 133,259,667 people shows a substantial negative correlation between the proportion of Immigrants from Uruguay and percentage of population with at least bachelor's degree education in the United States with a correlation coefficient (R) of -0.561 and weighted average of 37.8%, a difference of 2.2%.
Bachelor's Degree Correlation Summary
| Measurement | Immigrants from South America | Immigrants from Uruguay |
| Minimum | 5.3% | 6.5% |
| Maximum | 69.7% | 45.3% |
| Range | 64.4% | 38.8% |
| Mean | 37.6% | 28.4% |
| Median | 36.4% | 34.4% |
| Interquartile 25% (IQ1) | 30.4% | 20.6% |
| Interquartile 75% (IQ3) | 41.9% | 37.0% |
| Interquartile Range (IQR) | 11.5% | 16.4% |
| Standard Deviation (Sample) | 13.4% | 12.1% |
| Standard Deviation (Population) | 13.4% | 11.7% |
Demographics Similar to Immigrants from South America and Immigrants from Uruguay by Bachelor's Degree
In terms of bachelor's degree, the demographic groups most similar to Immigrants from South America are Immigrants from Germany (38.6%, a difference of 0.060%), Kenyan (38.7%, a difference of 0.28%), Chinese (38.5%, a difference of 0.39%), Vietnamese (38.5%, a difference of 0.39%), and Uruguayan (38.4%, a difference of 0.48%). Similarly, the demographic groups most similar to Immigrants from Uruguay are Costa Rican (37.7%, a difference of 0.080%), Immigrants from Bangladesh (37.8%, a difference of 0.16%), Immigrants from Iraq (37.9%, a difference of 0.41%), Immigrants from Somalia (37.9%, a difference of 0.43%), and Bermudan (38.0%, a difference of 0.57%).
| Demographics | Rating | Rank | Bachelor's Degree |
| Kenyans | 72.5 /100 | #156 | Good 38.7% |
| Immigrants | South America | 70.1 /100 | #157 | Good 38.6% |
| Immigrants | Germany | 69.6 /100 | #158 | Good 38.6% |
| Chinese | 66.6 /100 | #159 | Good 38.5% |
| Vietnamese | 66.6 /100 | #160 | Good 38.5% |
| Uruguayans | 65.8 /100 | #161 | Good 38.4% |
| Colombians | 65.0 /100 | #162 | Good 38.4% |
| Peruvians | 63.4 /100 | #163 | Good 38.3% |
| Hungarians | 62.1 /100 | #164 | Good 38.3% |
| Sri Lankans | 59.1 /100 | #165 | Average 38.2% |
| Somalis | 58.6 /100 | #166 | Average 38.1% |
| Scottish | 56.6 /100 | #167 | Average 38.1% |
| Danes | 56.2 /100 | #168 | Average 38.1% |
| Ghanaians | 55.3 /100 | #169 | Average 38.0% |
| Czechs | 54.4 /100 | #170 | Average 38.0% |
| Bermudans | 54.2 /100 | #171 | Average 38.0% |
| Immigrants | Somalia | 52.8 /100 | #172 | Average 37.9% |
| Immigrants | Iraq | 52.5 /100 | #173 | Average 37.9% |
| Immigrants | Bangladesh | 50.0 /100 | #174 | Average 37.8% |
| Immigrants | Uruguay | 48.3 /100 | #175 | Average 37.8% |
| Costa Ricans | 47.6 /100 | #176 | Average 37.7% |