Immigrants from Bangladesh vs Jamaican Bachelor's Degree
COMPARE
Immigrants from Bangladesh
Jamaican
Bachelor's Degree
Bachelor's Degree Comparison
Immigrants from Bangladesh
Jamaicans
37.8%
BACHELOR'S DEGREE
50.0/ 100
METRIC RATING
174th/ 347
METRIC RANK
33.6%
BACHELOR'S DEGREE
1.0/ 100
METRIC RATING
246th/ 347
METRIC RANK
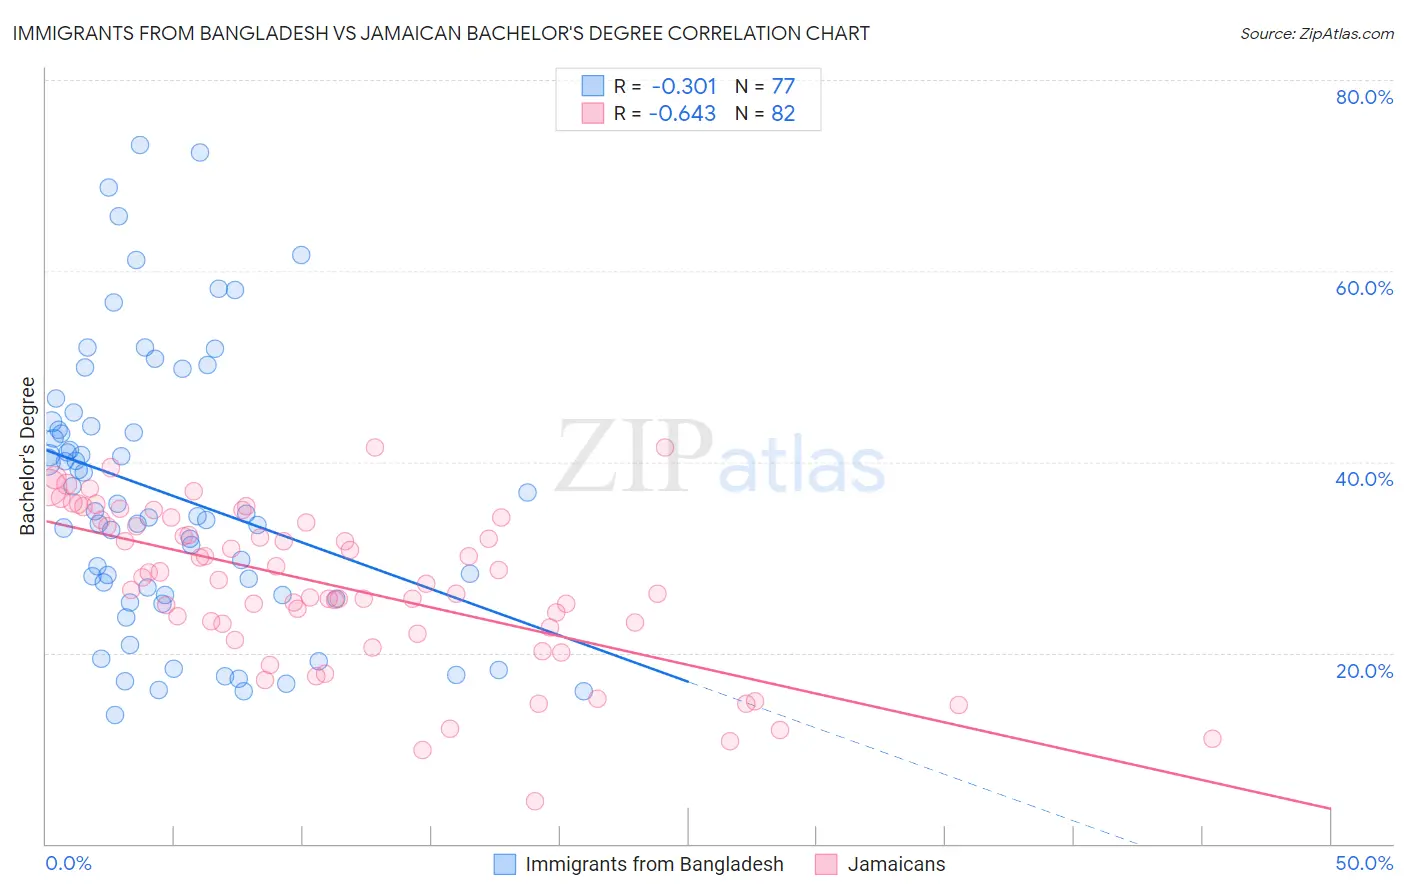
Immigrants from Bangladesh vs Jamaican Bachelor's Degree Correlation Chart
The statistical analysis conducted on geographies consisting of 203,673,511 people shows a mild negative correlation between the proportion of Immigrants from Bangladesh and percentage of population with at least bachelor's degree education in the United States with a correlation coefficient (R) of -0.301 and weighted average of 37.8%. Similarly, the statistical analysis conducted on geographies consisting of 368,011,400 people shows a significant negative correlation between the proportion of Jamaicans and percentage of population with at least bachelor's degree education in the United States with a correlation coefficient (R) of -0.643 and weighted average of 33.6%, a difference of 12.5%.
Bachelor's Degree Correlation Summary
| Measurement | Immigrants from Bangladesh | Jamaican |
| Minimum | 13.5% | 4.5% |
| Maximum | 73.2% | 41.5% |
| Range | 59.7% | 37.0% |
| Mean | 36.6% | 27.0% |
| Median | 34.5% | 27.5% |
| Interquartile 25% (IQ1) | 26.1% | 22.7% |
| Interquartile 75% (IQ3) | 44.0% | 33.7% |
| Interquartile Range (IQR) | 17.9% | 11.0% |
| Standard Deviation (Sample) | 14.4% | 8.2% |
| Standard Deviation (Population) | 14.3% | 8.1% |
Similar Demographics by Bachelor's Degree
Demographics Similar to Immigrants from Bangladesh by Bachelor's Degree
In terms of bachelor's degree, the demographic groups most similar to Immigrants from Bangladesh are Immigrants from Uruguay (37.8%, a difference of 0.16%), Costa Rican (37.7%, a difference of 0.24%), Immigrants from Iraq (37.9%, a difference of 0.25%), Basque (37.7%, a difference of 0.25%), and Immigrants from Somalia (37.9%, a difference of 0.27%).
| Demographics | Rating | Rank | Bachelor's Degree |
| Scottish | 56.6 /100 | #167 | Average 38.1% |
| Danes | 56.2 /100 | #168 | Average 38.1% |
| Ghanaians | 55.3 /100 | #169 | Average 38.0% |
| Czechs | 54.4 /100 | #170 | Average 38.0% |
| Bermudans | 54.2 /100 | #171 | Average 38.0% |
| Immigrants | Somalia | 52.8 /100 | #172 | Average 37.9% |
| Immigrants | Iraq | 52.5 /100 | #173 | Average 37.9% |
| Immigrants | Bangladesh | 50.0 /100 | #174 | Average 37.8% |
| Immigrants | Uruguay | 48.3 /100 | #175 | Average 37.8% |
| Costa Ricans | 47.6 /100 | #176 | Average 37.7% |
| Basques | 47.4 /100 | #177 | Average 37.7% |
| Immigrants | Cameroon | 46.8 /100 | #178 | Average 37.7% |
| Immigrants | Colombia | 45.4 /100 | #179 | Average 37.7% |
| Irish | 44.3 /100 | #180 | Average 37.6% |
| Immigrants | Senegal | 43.8 /100 | #181 | Average 37.6% |
Demographics Similar to Jamaicans by Bachelor's Degree
In terms of bachelor's degree, the demographic groups most similar to Jamaicans are Immigrants from Congo (33.6%, a difference of 0.090%), Cree (33.6%, a difference of 0.10%), Immigrants from Liberia (33.5%, a difference of 0.23%), Indonesian (33.5%, a difference of 0.24%), and Immigrants from Fiji (33.7%, a difference of 0.36%).
| Demographics | Rating | Rank | Bachelor's Degree |
| British West Indians | 2.5 /100 | #239 | Tragic 34.5% |
| Tongans | 2.0 /100 | #240 | Tragic 34.3% |
| Immigrants | Cambodia | 1.9 /100 | #241 | Tragic 34.2% |
| Immigrants | Nonimmigrants | 1.8 /100 | #242 | Tragic 34.2% |
| Immigrants | Guyana | 1.4 /100 | #243 | Tragic 33.9% |
| Delaware | 1.2 /100 | #244 | Tragic 33.8% |
| Immigrants | Fiji | 1.2 /100 | #245 | Tragic 33.7% |
| Jamaicans | 1.0 /100 | #246 | Tragic 33.6% |
| Immigrants | Congo | 1.0 /100 | #247 | Tragic 33.6% |
| Cree | 1.0 /100 | #248 | Tragic 33.6% |
| Immigrants | Liberia | 0.9 /100 | #249 | Tragic 33.5% |
| Indonesians | 0.9 /100 | #250 | Tragic 33.5% |
| Japanese | 0.7 /100 | #251 | Tragic 33.3% |
| Immigrants | Bahamas | 0.7 /100 | #252 | Tragic 33.3% |
| U.S. Virgin Islanders | 0.7 /100 | #253 | Tragic 33.2% |