Immigrants from Trinidad and Tobago vs Bangladeshi 6th Grade
COMPARE
Immigrants from Trinidad and Tobago
Bangladeshi
6th Grade
6th Grade Comparison
Immigrants from Trinidad and Tobago
Bangladeshis
96.2%
6TH GRADE
0.0/ 100
METRIC RATING
287th/ 347
METRIC RANK
95.7%
6TH GRADE
0.0/ 100
METRIC RATING
303rd/ 347
METRIC RANK
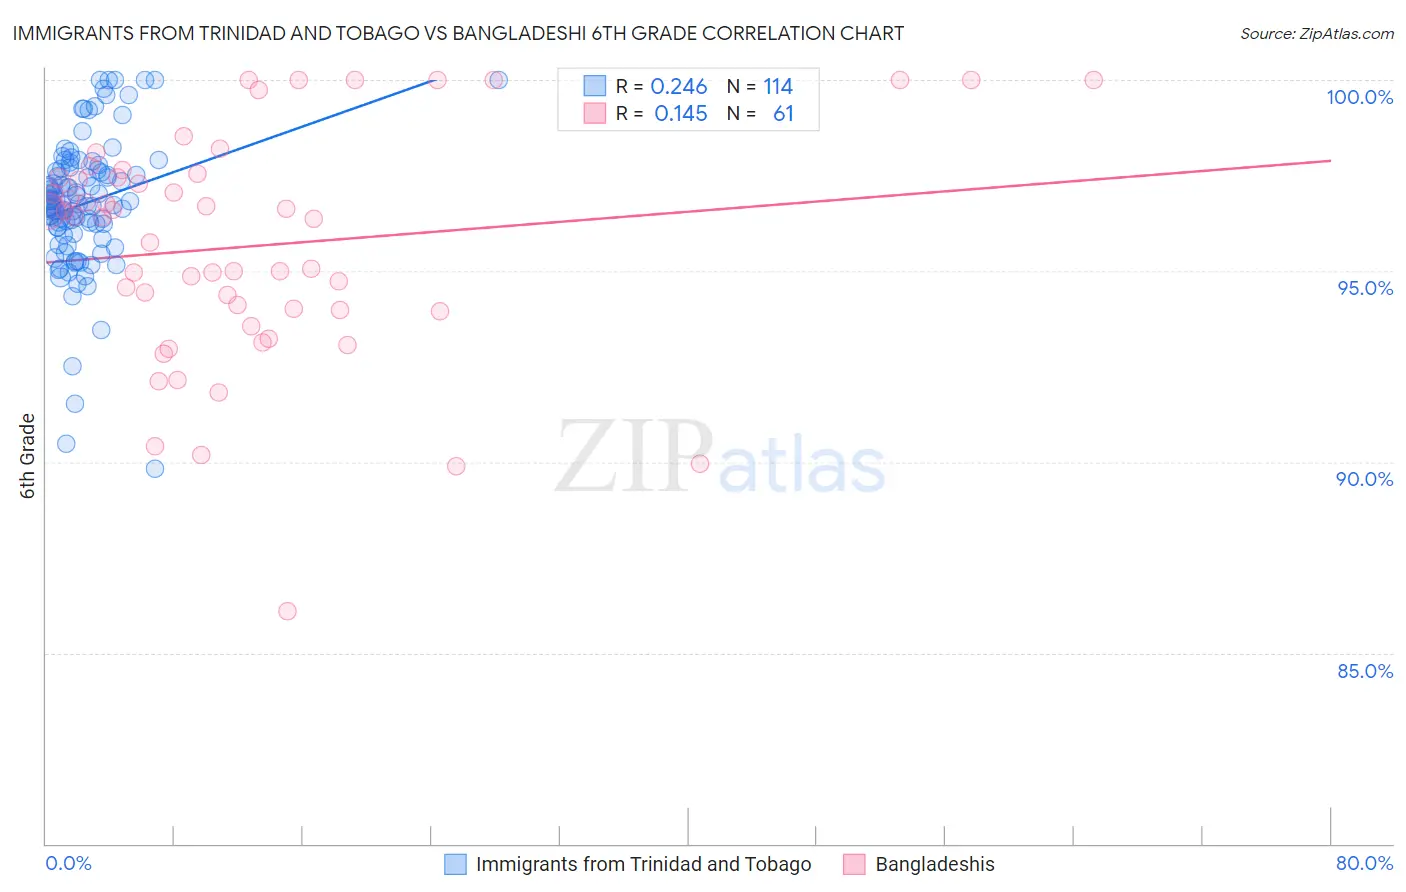
Immigrants from Trinidad and Tobago vs Bangladeshi 6th Grade Correlation Chart
The statistical analysis conducted on geographies consisting of 223,526,834 people shows a weak positive correlation between the proportion of Immigrants from Trinidad and Tobago and percentage of population with at least 6th grade education in the United States with a correlation coefficient (R) of 0.246 and weighted average of 96.2%. Similarly, the statistical analysis conducted on geographies consisting of 141,430,495 people shows a poor positive correlation between the proportion of Bangladeshis and percentage of population with at least 6th grade education in the United States with a correlation coefficient (R) of 0.145 and weighted average of 95.7%, a difference of 0.54%.
6th Grade Correlation Summary
| Measurement | Immigrants from Trinidad and Tobago | Bangladeshi |
| Minimum | 89.8% | 86.1% |
| Maximum | 100.0% | 100.0% |
| Range | 10.2% | 13.9% |
| Mean | 96.8% | 95.7% |
| Median | 96.7% | 96.4% |
| Interquartile 25% (IQ1) | 96.1% | 94.0% |
| Interquartile 75% (IQ3) | 97.6% | 97.5% |
| Interquartile Range (IQR) | 1.5% | 3.5% |
| Standard Deviation (Sample) | 1.8% | 3.0% |
| Standard Deviation (Population) | 1.8% | 3.0% |
Demographics Similar to Immigrants from Trinidad and Tobago and Bangladeshis by 6th Grade
In terms of 6th grade, the demographic groups most similar to Immigrants from Trinidad and Tobago are Barbadian (96.2%, a difference of 0.010%), Malaysian (96.2%, a difference of 0.010%), Immigrants from Eritrea (96.1%, a difference of 0.030%), Somali (96.2%, a difference of 0.040%), and Immigrants from Somalia (96.1%, a difference of 0.050%). Similarly, the demographic groups most similar to Bangladeshis are Indonesian (95.6%, a difference of 0.010%), Immigrants from Cuba (95.6%, a difference of 0.030%), Immigrants from Burma/Myanmar (95.7%, a difference of 0.070%), Immigrants (95.7%, a difference of 0.080%), and Immigrants from Dominica (95.7%, a difference of 0.090%).
| Demographics | Rating | Rank | 6th Grade |
| Somalis | 0.1 /100 | #285 | Tragic 96.2% |
| Barbadians | 0.0 /100 | #286 | Tragic 96.2% |
| Immigrants | Trinidad and Tobago | 0.0 /100 | #287 | Tragic 96.2% |
| Malaysians | 0.0 /100 | #288 | Tragic 96.2% |
| Immigrants | Eritrea | 0.0 /100 | #289 | Tragic 96.1% |
| Immigrants | Somalia | 0.0 /100 | #290 | Tragic 96.1% |
| Immigrants | St. Vincent and the Grenadines | 0.0 /100 | #291 | Tragic 96.1% |
| Immigrants | Barbados | 0.0 /100 | #292 | Tragic 96.1% |
| Immigrants | West Indies | 0.0 /100 | #293 | Tragic 96.1% |
| British West Indians | 0.0 /100 | #294 | Tragic 96.0% |
| Immigrants | Grenada | 0.0 /100 | #295 | Tragic 95.9% |
| Immigrants | South Eastern Asia | 0.0 /100 | #296 | Tragic 95.9% |
| Haitians | 0.0 /100 | #297 | Tragic 95.8% |
| Sri Lankans | 0.0 /100 | #298 | Tragic 95.8% |
| Immigrants | Laos | 0.0 /100 | #299 | Tragic 95.7% |
| Immigrants | Dominica | 0.0 /100 | #300 | Tragic 95.7% |
| Immigrants | Immigrants | 0.0 /100 | #301 | Tragic 95.7% |
| Immigrants | Burma/Myanmar | 0.0 /100 | #302 | Tragic 95.7% |
| Bangladeshis | 0.0 /100 | #303 | Tragic 95.7% |
| Indonesians | 0.0 /100 | #304 | Tragic 95.6% |
| Immigrants | Cuba | 0.0 /100 | #305 | Tragic 95.6% |