Immigrants from South Africa vs Immigrants from Belize 6th Grade
COMPARE
Immigrants from South Africa
Immigrants from Belize
6th Grade
6th Grade Comparison
Immigrants from South Africa
Immigrants from Belize
97.5%
6TH GRADE
98.9/ 100
METRIC RATING
88th/ 347
METRIC RANK
95.3%
6TH GRADE
0.0/ 100
METRIC RATING
319th/ 347
METRIC RANK
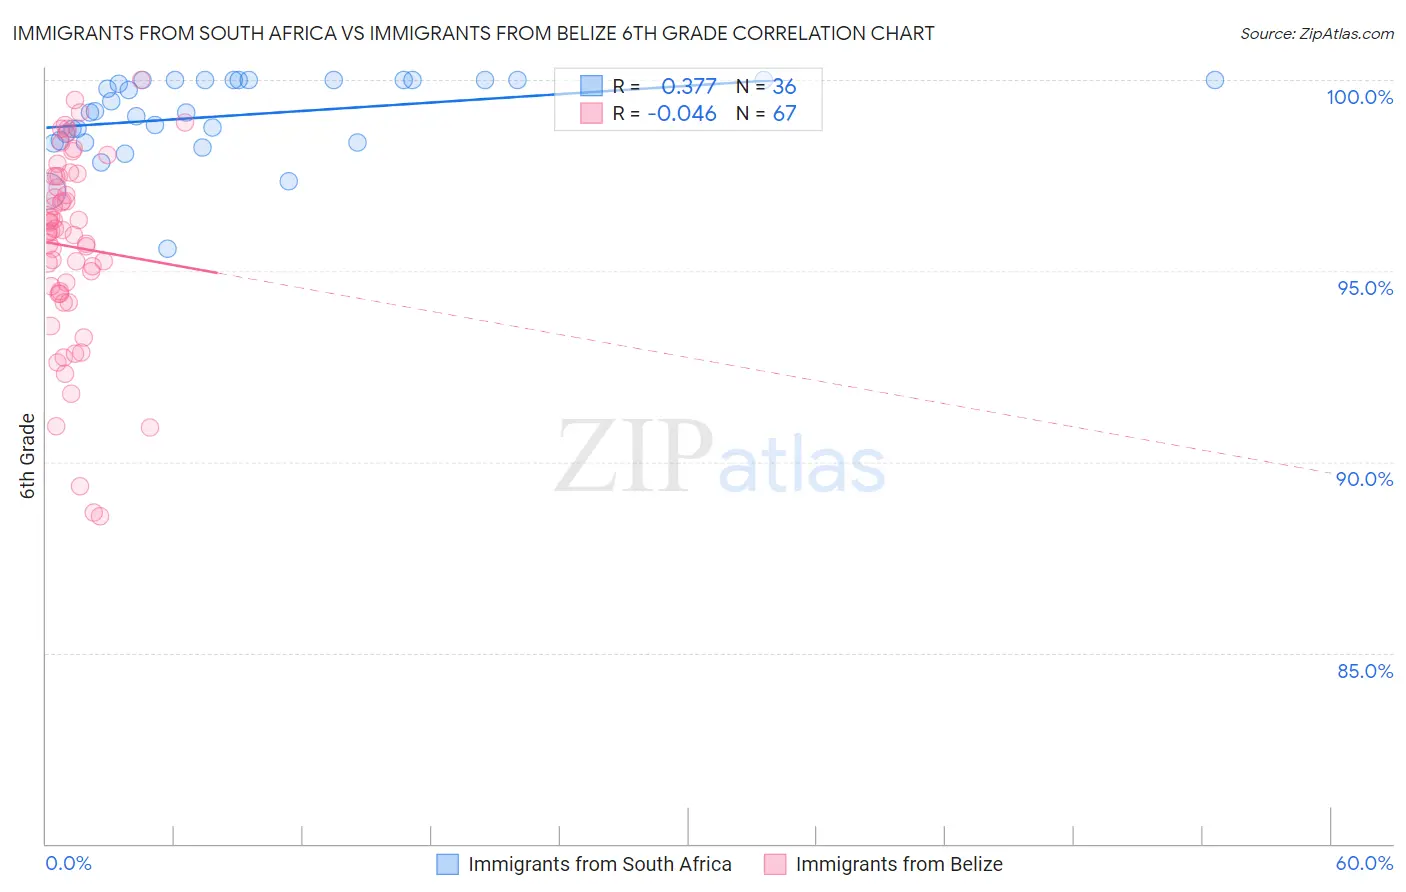
Immigrants from South Africa vs Immigrants from Belize 6th Grade Correlation Chart
The statistical analysis conducted on geographies consisting of 233,321,693 people shows a mild positive correlation between the proportion of Immigrants from South Africa and percentage of population with at least 6th grade education in the United States with a correlation coefficient (R) of 0.377 and weighted average of 97.5%. Similarly, the statistical analysis conducted on geographies consisting of 130,180,317 people shows no correlation between the proportion of Immigrants from Belize and percentage of population with at least 6th grade education in the United States with a correlation coefficient (R) of -0.046 and weighted average of 95.3%, a difference of 2.4%.
6th Grade Correlation Summary
| Measurement | Immigrants from South Africa | Immigrants from Belize |
| Minimum | 95.6% | 88.6% |
| Maximum | 100.0% | 100.0% |
| Range | 4.4% | 11.4% |
| Mean | 99.1% | 95.6% |
| Median | 99.2% | 96.0% |
| Interquartile 25% (IQ1) | 98.4% | 94.4% |
| Interquartile 75% (IQ3) | 100.0% | 97.5% |
| Interquartile Range (IQR) | 1.6% | 3.1% |
| Standard Deviation (Sample) | 1.0% | 2.5% |
| Standard Deviation (Population) | 1.0% | 2.5% |
Similar Demographics by 6th Grade
Demographics Similar to Immigrants from South Africa by 6th Grade
In terms of 6th grade, the demographic groups most similar to Immigrants from South Africa are Immigrants from Belgium (97.5%, a difference of 0.0%), Puget Sound Salish (97.5%, a difference of 0.0%), Immigrants from Australia (97.5%, a difference of 0.0%), Delaware (97.6%, a difference of 0.010%), and Pueblo (97.5%, a difference of 0.010%).
| Demographics | Rating | Rank | 6th Grade |
| Lumbee | 99.2 /100 | #81 | Exceptional 97.6% |
| Zimbabweans | 99.1 /100 | #82 | Exceptional 97.6% |
| Potawatomi | 99.1 /100 | #83 | Exceptional 97.6% |
| Shoshone | 99.0 /100 | #84 | Exceptional 97.6% |
| Delaware | 98.9 /100 | #85 | Exceptional 97.6% |
| Immigrants | Belgium | 98.9 /100 | #86 | Exceptional 97.5% |
| Puget Sound Salish | 98.9 /100 | #87 | Exceptional 97.5% |
| Immigrants | South Africa | 98.9 /100 | #88 | Exceptional 97.5% |
| Immigrants | Australia | 98.8 /100 | #89 | Exceptional 97.5% |
| Pueblo | 98.8 /100 | #90 | Exceptional 97.5% |
| Immigrants | Western Europe | 98.8 /100 | #91 | Exceptional 97.5% |
| Romanians | 98.7 /100 | #92 | Exceptional 97.5% |
| Cree | 98.7 /100 | #93 | Exceptional 97.5% |
| Cypriots | 98.7 /100 | #94 | Exceptional 97.5% |
| Immigrants | Ireland | 98.7 /100 | #95 | Exceptional 97.5% |
Demographics Similar to Immigrants from Belize by 6th Grade
In terms of 6th grade, the demographic groups most similar to Immigrants from Belize are Belizean (95.3%, a difference of 0.010%), Vietnamese (95.3%, a difference of 0.030%), Immigrants from Ecuador (95.3%, a difference of 0.030%), Japanese (95.4%, a difference of 0.070%), and Immigrants from Vietnam (95.4%, a difference of 0.080%).
| Demographics | Rating | Rank | 6th Grade |
| Immigrants | Guyana | 0.0 /100 | #312 | Tragic 95.5% |
| Nicaraguans | 0.0 /100 | #313 | Tragic 95.4% |
| Immigrants | Vietnam | 0.0 /100 | #314 | Tragic 95.4% |
| Immigrants | Bangladesh | 0.0 /100 | #315 | Tragic 95.4% |
| Japanese | 0.0 /100 | #316 | Tragic 95.4% |
| Vietnamese | 0.0 /100 | #317 | Tragic 95.3% |
| Belizeans | 0.0 /100 | #318 | Tragic 95.3% |
| Immigrants | Belize | 0.0 /100 | #319 | Tragic 95.3% |
| Immigrants | Ecuador | 0.0 /100 | #320 | Tragic 95.3% |
| Immigrants | Fiji | 0.0 /100 | #321 | Tragic 95.2% |
| Immigrants | Cambodia | 0.0 /100 | #322 | Tragic 95.2% |
| Central American Indians | 0.0 /100 | #323 | Tragic 95.1% |
| Cape Verdeans | 0.0 /100 | #324 | Tragic 95.1% |
| Immigrants | Nicaragua | 0.0 /100 | #325 | Tragic 95.1% |
| Hispanics or Latinos | 0.0 /100 | #326 | Tragic 95.0% |