Immigrants from North Macedonia vs Bangladeshi 6th Grade
COMPARE
Immigrants from North Macedonia
Bangladeshi
6th Grade
6th Grade Comparison
Immigrants from North Macedonia
Bangladeshis
97.2%
6TH GRADE
85.5/ 100
METRIC RATING
140th/ 347
METRIC RANK
95.7%
6TH GRADE
0.0/ 100
METRIC RATING
303rd/ 347
METRIC RANK
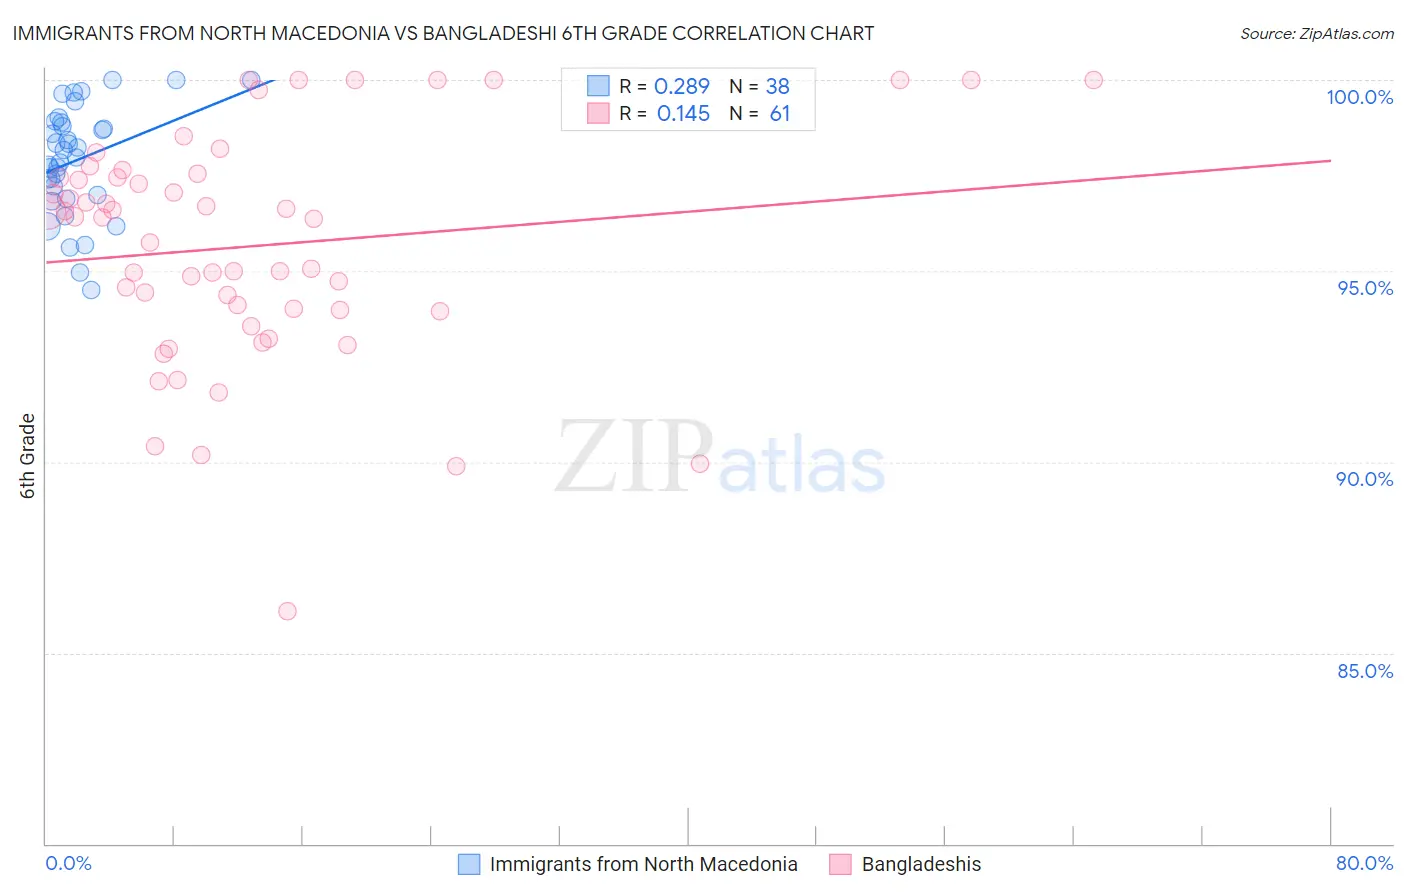
Immigrants from North Macedonia vs Bangladeshi 6th Grade Correlation Chart
The statistical analysis conducted on geographies consisting of 74,317,186 people shows a weak positive correlation between the proportion of Immigrants from North Macedonia and percentage of population with at least 6th grade education in the United States with a correlation coefficient (R) of 0.289 and weighted average of 97.2%. Similarly, the statistical analysis conducted on geographies consisting of 141,430,495 people shows a poor positive correlation between the proportion of Bangladeshis and percentage of population with at least 6th grade education in the United States with a correlation coefficient (R) of 0.145 and weighted average of 95.7%, a difference of 1.7%.
6th Grade Correlation Summary
| Measurement | Immigrants from North Macedonia | Bangladeshi |
| Minimum | 94.5% | 86.1% |
| Maximum | 100.0% | 100.0% |
| Range | 5.5% | 13.9% |
| Mean | 97.9% | 95.7% |
| Median | 98.1% | 96.4% |
| Interquartile 25% (IQ1) | 97.0% | 94.0% |
| Interquartile 75% (IQ3) | 98.9% | 97.5% |
| Interquartile Range (IQR) | 1.9% | 3.5% |
| Standard Deviation (Sample) | 1.4% | 3.0% |
| Standard Deviation (Population) | 1.4% | 3.0% |
Similar Demographics by 6th Grade
Demographics Similar to Immigrants from North Macedonia by 6th Grade
In terms of 6th grade, the demographic groups most similar to Immigrants from North Macedonia are Immigrants from Turkey (97.3%, a difference of 0.010%), Seminole (97.2%, a difference of 0.010%), Jordanian (97.2%, a difference of 0.010%), Burmese (97.3%, a difference of 0.020%), and Blackfeet (97.3%, a difference of 0.020%).
| Demographics | Rating | Rank | 6th Grade |
| Immigrants | Moldova | 90.0 /100 | #133 | Excellent 97.3% |
| Immigrants | Kuwait | 89.5 /100 | #134 | Excellent 97.3% |
| Immigrants | Hungary | 89.5 /100 | #135 | Excellent 97.3% |
| Filipinos | 88.9 /100 | #136 | Excellent 97.3% |
| Burmese | 87.8 /100 | #137 | Excellent 97.3% |
| Blackfeet | 87.7 /100 | #138 | Excellent 97.3% |
| Immigrants | Turkey | 86.1 /100 | #139 | Excellent 97.3% |
| Immigrants | North Macedonia | 85.5 /100 | #140 | Excellent 97.2% |
| Seminole | 84.8 /100 | #141 | Excellent 97.2% |
| Jordanians | 84.6 /100 | #142 | Excellent 97.2% |
| Pima | 82.9 /100 | #143 | Excellent 97.2% |
| Israelis | 82.9 /100 | #144 | Excellent 97.2% |
| Spaniards | 80.1 /100 | #145 | Excellent 97.2% |
| Hopi | 78.8 /100 | #146 | Good 97.2% |
| Immigrants | South Central Asia | 78.1 /100 | #147 | Good 97.2% |
Demographics Similar to Bangladeshis by 6th Grade
In terms of 6th grade, the demographic groups most similar to Bangladeshis are Indonesian (95.6%, a difference of 0.010%), Immigrants from Cuba (95.6%, a difference of 0.030%), Immigrants from Burma/Myanmar (95.7%, a difference of 0.070%), Immigrants from Haiti (95.6%, a difference of 0.070%), and Immigrants (95.7%, a difference of 0.080%).
| Demographics | Rating | Rank | 6th Grade |
| Immigrants | South Eastern Asia | 0.0 /100 | #296 | Tragic 95.9% |
| Haitians | 0.0 /100 | #297 | Tragic 95.8% |
| Sri Lankans | 0.0 /100 | #298 | Tragic 95.8% |
| Immigrants | Laos | 0.0 /100 | #299 | Tragic 95.7% |
| Immigrants | Dominica | 0.0 /100 | #300 | Tragic 95.7% |
| Immigrants | Immigrants | 0.0 /100 | #301 | Tragic 95.7% |
| Immigrants | Burma/Myanmar | 0.0 /100 | #302 | Tragic 95.7% |
| Bangladeshis | 0.0 /100 | #303 | Tragic 95.7% |
| Indonesians | 0.0 /100 | #304 | Tragic 95.6% |
| Immigrants | Cuba | 0.0 /100 | #305 | Tragic 95.6% |
| Immigrants | Haiti | 0.0 /100 | #306 | Tragic 95.6% |
| Guyanese | 0.0 /100 | #307 | Tragic 95.6% |
| Immigrants | Caribbean | 0.0 /100 | #308 | Tragic 95.6% |
| Puerto Ricans | 0.0 /100 | #309 | Tragic 95.5% |
| Ecuadorians | 0.0 /100 | #310 | Tragic 95.5% |