Immigrants from Somalia vs Sierra Leonean Bachelor's Degree
COMPARE
Immigrants from Somalia
Sierra Leonean
Bachelor's Degree
Bachelor's Degree Comparison
Immigrants from Somalia
Sierra Leoneans
37.9%
BACHELOR'S DEGREE
52.8/ 100
METRIC RATING
172nd/ 347
METRIC RANK
40.1%
BACHELOR'S DEGREE
92.2/ 100
METRIC RATING
130th/ 347
METRIC RANK
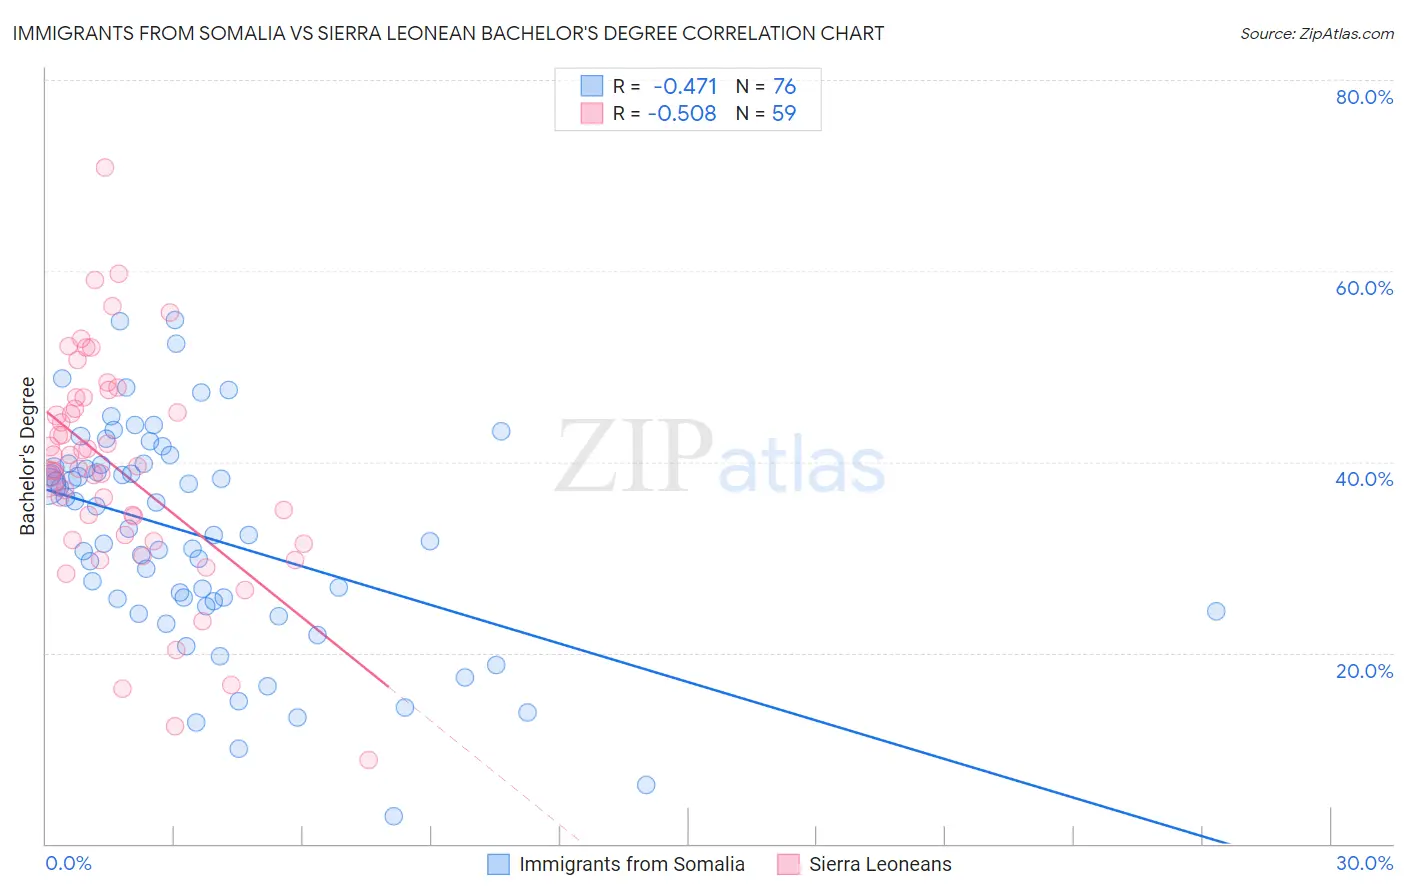
Immigrants from Somalia vs Sierra Leonean Bachelor's Degree Correlation Chart
The statistical analysis conducted on geographies consisting of 92,111,755 people shows a moderate negative correlation between the proportion of Immigrants from Somalia and percentage of population with at least bachelor's degree education in the United States with a correlation coefficient (R) of -0.471 and weighted average of 37.9%. Similarly, the statistical analysis conducted on geographies consisting of 83,362,711 people shows a substantial negative correlation between the proportion of Sierra Leoneans and percentage of population with at least bachelor's degree education in the United States with a correlation coefficient (R) of -0.508 and weighted average of 40.1%, a difference of 5.7%.
Bachelor's Degree Correlation Summary
| Measurement | Immigrants from Somalia | Sierra Leonean |
| Minimum | 2.9% | 8.8% |
| Maximum | 54.9% | 70.8% |
| Range | 52.0% | 62.1% |
| Mean | 32.2% | 39.2% |
| Median | 32.7% | 39.3% |
| Interquartile 25% (IQ1) | 25.1% | 31.8% |
| Interquartile 75% (IQ3) | 39.7% | 46.8% |
| Interquartile Range (IQR) | 14.6% | 15.0% |
| Standard Deviation (Sample) | 11.4% | 11.8% |
| Standard Deviation (Population) | 11.3% | 11.7% |
Similar Demographics by Bachelor's Degree
Demographics Similar to Immigrants from Somalia by Bachelor's Degree
In terms of bachelor's degree, the demographic groups most similar to Immigrants from Somalia are Immigrants from Iraq (37.9%, a difference of 0.020%), Bermudan (38.0%, a difference of 0.14%), Czech (38.0%, a difference of 0.15%), Ghanaian (38.0%, a difference of 0.25%), and Immigrants from Bangladesh (37.8%, a difference of 0.27%).
| Demographics | Rating | Rank | Bachelor's Degree |
| Sri Lankans | 59.1 /100 | #165 | Average 38.2% |
| Somalis | 58.6 /100 | #166 | Average 38.1% |
| Scottish | 56.6 /100 | #167 | Average 38.1% |
| Danes | 56.2 /100 | #168 | Average 38.1% |
| Ghanaians | 55.3 /100 | #169 | Average 38.0% |
| Czechs | 54.4 /100 | #170 | Average 38.0% |
| Bermudans | 54.2 /100 | #171 | Average 38.0% |
| Immigrants | Somalia | 52.8 /100 | #172 | Average 37.9% |
| Immigrants | Iraq | 52.5 /100 | #173 | Average 37.9% |
| Immigrants | Bangladesh | 50.0 /100 | #174 | Average 37.8% |
| Immigrants | Uruguay | 48.3 /100 | #175 | Average 37.8% |
| Costa Ricans | 47.6 /100 | #176 | Average 37.7% |
| Basques | 47.4 /100 | #177 | Average 37.7% |
| Immigrants | Cameroon | 46.8 /100 | #178 | Average 37.7% |
| Immigrants | Colombia | 45.4 /100 | #179 | Average 37.7% |
Demographics Similar to Sierra Leoneans by Bachelor's Degree
In terms of bachelor's degree, the demographic groups most similar to Sierra Leoneans are Serbian (40.1%, a difference of 0.070%), Italian (40.1%, a difference of 0.080%), Immigrants from Venezuela (40.2%, a difference of 0.24%), Taiwanese (40.0%, a difference of 0.33%), and Immigrants from Southern Europe (40.0%, a difference of 0.33%).
| Demographics | Rating | Rank | Bachelor's Degree |
| Lebanese | 94.3 /100 | #123 | Exceptional 40.4% |
| Immigrants | Eritrea | 94.3 /100 | #124 | Exceptional 40.4% |
| British | 94.2 /100 | #125 | Exceptional 40.4% |
| Immigrants | Eastern Africa | 94.1 /100 | #126 | Exceptional 40.4% |
| Immigrants | Jordan | 93.4 /100 | #127 | Exceptional 40.3% |
| Immigrants | Venezuela | 92.9 /100 | #128 | Exceptional 40.2% |
| Serbians | 92.4 /100 | #129 | Exceptional 40.1% |
| Sierra Leoneans | 92.2 /100 | #130 | Exceptional 40.1% |
| Italians | 91.9 /100 | #131 | Exceptional 40.1% |
| Taiwanese | 91.1 /100 | #132 | Exceptional 40.0% |
| Immigrants | Southern Europe | 91.1 /100 | #133 | Exceptional 40.0% |
| Assyrians/Chaldeans/Syriacs | 89.4 /100 | #134 | Excellent 39.8% |
| Luxembourgers | 89.1 /100 | #135 | Excellent 39.8% |
| Pakistanis | 88.2 /100 | #136 | Excellent 39.7% |
| Icelanders | 86.5 /100 | #137 | Excellent 39.5% |