Immigrants from Somalia vs Filipino Unemployment Among Ages 16 to 19 years
COMPARE
Immigrants from Somalia
Filipino
Unemployment Among Ages 16 to 19 years
Unemployment Among Ages 16 to 19 years Comparison
Immigrants from Somalia
Filipinos
15.3%
UNEMPLOYMENT AMONG AGES 16 TO 19 YEARS
100.0/ 100
METRIC RATING
5th/ 347
METRIC RANK
15.9%
UNEMPLOYMENT AMONG AGES 16 TO 19 YEARS
100.0/ 100
METRIC RATING
25th/ 347
METRIC RANK
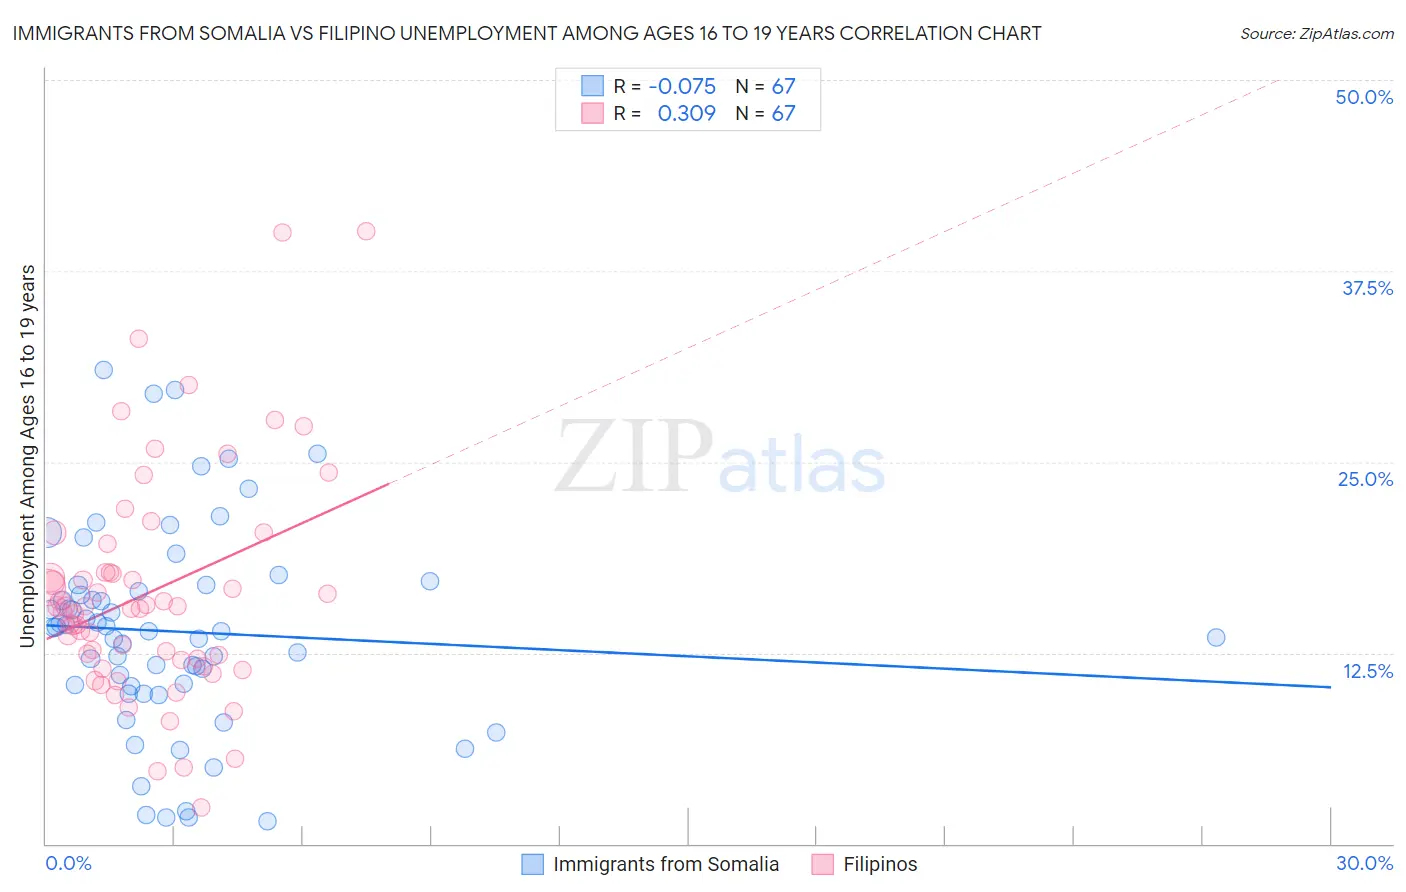
Immigrants from Somalia vs Filipino Unemployment Among Ages 16 to 19 years Correlation Chart
The statistical analysis conducted on geographies consisting of 91,223,473 people shows a slight negative correlation between the proportion of Immigrants from Somalia and unemployment rate among population between the ages 16 and 19 in the United States with a correlation coefficient (R) of -0.075 and weighted average of 15.3%. Similarly, the statistical analysis conducted on geographies consisting of 245,673,937 people shows a mild positive correlation between the proportion of Filipinos and unemployment rate among population between the ages 16 and 19 in the United States with a correlation coefficient (R) of 0.309 and weighted average of 15.9%, a difference of 4.3%.
Unemployment Among Ages 16 to 19 years Correlation Summary
| Measurement | Immigrants from Somalia | Filipino |
| Minimum | 1.5% | 2.4% |
| Maximum | 31.0% | 40.1% |
| Range | 29.5% | 37.7% |
| Mean | 13.9% | 16.4% |
| Median | 13.9% | 15.5% |
| Interquartile 25% (IQ1) | 10.3% | 12.0% |
| Interquartile 75% (IQ3) | 16.9% | 17.8% |
| Interquartile Range (IQR) | 6.6% | 5.8% |
| Standard Deviation (Sample) | 6.7% | 7.4% |
| Standard Deviation (Population) | 6.6% | 7.3% |
Demographics Similar to Immigrants from Somalia and Filipinos by Unemployment Among Ages 16 to 19 years
In terms of unemployment among ages 16 to 19 years, the demographic groups most similar to Immigrants from Somalia are Swedish (15.3%, a difference of 0.27%), Immigrants from Bosnia and Herzegovina (15.3%, a difference of 0.44%), Czech (15.4%, a difference of 0.68%), Scandinavian (15.4%, a difference of 1.0%), and Zimbabwean (15.4%, a difference of 1.1%). Similarly, the demographic groups most similar to Filipinos are Tongan (15.9%, a difference of 0.10%), Belgian (15.9%, a difference of 0.25%), Finnish (15.9%, a difference of 0.29%), Immigrants from Taiwan (15.8%, a difference of 0.65%), and Sudanese (15.8%, a difference of 0.98%).
| Demographics | Rating | Rank | Unemployment Among Ages 16 to 19 years |
| Immigrants | Somalia | 100.0 /100 | #5 | Exceptional 15.3% |
| Swedes | 100.0 /100 | #6 | Exceptional 15.3% |
| Immigrants | Bosnia and Herzegovina | 100.0 /100 | #7 | Exceptional 15.3% |
| Czechs | 100.0 /100 | #8 | Exceptional 15.4% |
| Scandinavians | 100.0 /100 | #9 | Exceptional 15.4% |
| Zimbabweans | 100.0 /100 | #10 | Exceptional 15.4% |
| Indonesians | 100.0 /100 | #11 | Exceptional 15.5% |
| Taiwanese | 100.0 /100 | #12 | Exceptional 15.5% |
| Immigrants | Burma/Myanmar | 100.0 /100 | #13 | Exceptional 15.6% |
| Immigrants | Zaire | 100.0 /100 | #14 | Exceptional 15.6% |
| Yugoslavians | 100.0 /100 | #15 | Exceptional 15.6% |
| Germans | 100.0 /100 | #16 | Exceptional 15.7% |
| Somalis | 100.0 /100 | #17 | Exceptional 15.7% |
| Thais | 100.0 /100 | #18 | Exceptional 15.7% |
| Swiss | 100.0 /100 | #19 | Exceptional 15.8% |
| Sudanese | 100.0 /100 | #20 | Exceptional 15.8% |
| Immigrants | Taiwan | 100.0 /100 | #21 | Exceptional 15.8% |
| Finns | 100.0 /100 | #22 | Exceptional 15.9% |
| Belgians | 100.0 /100 | #23 | Exceptional 15.9% |
| Tongans | 100.0 /100 | #24 | Exceptional 15.9% |
| Filipinos | 100.0 /100 | #25 | Exceptional 15.9% |