Immigrants from Somalia vs Immigrants from West Indies 8th Grade
COMPARE
Immigrants from Somalia
Immigrants from West Indies
8th Grade
8th Grade Comparison
Immigrants from Somalia
Immigrants from West Indies
95.0%
8TH GRADE
0.7/ 100
METRIC RATING
255th/ 347
METRIC RANK
94.3%
8TH GRADE
0.0/ 100
METRIC RATING
290th/ 347
METRIC RANK
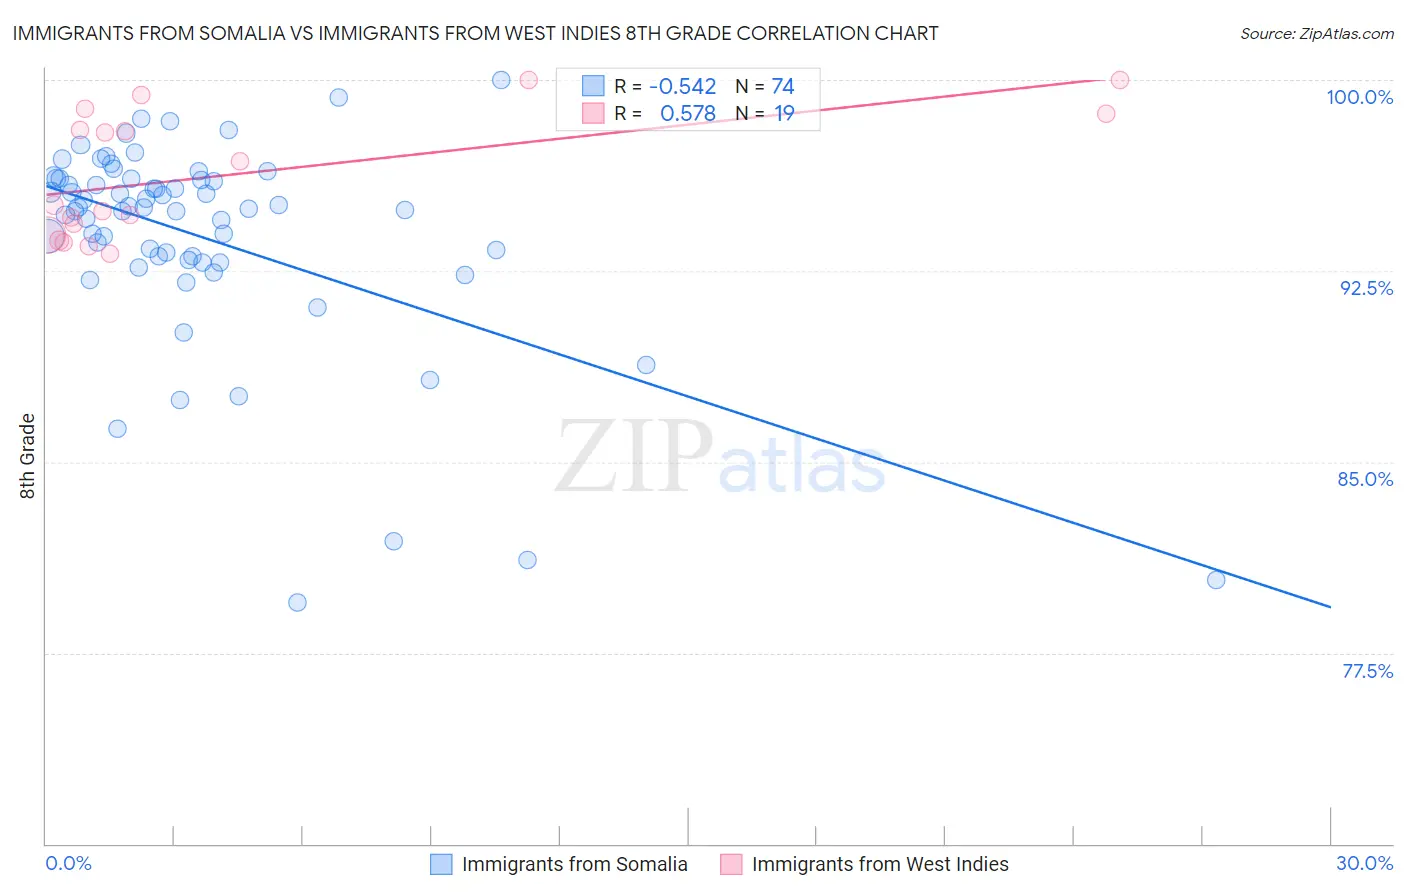
Immigrants from Somalia vs Immigrants from West Indies 8th Grade Correlation Chart
The statistical analysis conducted on geographies consisting of 92,098,504 people shows a substantial negative correlation between the proportion of Immigrants from Somalia and percentage of population with at least 8th grade education in the United States with a correlation coefficient (R) of -0.542 and weighted average of 95.0%. Similarly, the statistical analysis conducted on geographies consisting of 72,457,514 people shows a substantial positive correlation between the proportion of Immigrants from West Indies and percentage of population with at least 8th grade education in the United States with a correlation coefficient (R) of 0.578 and weighted average of 94.3%, a difference of 0.68%.
8th Grade Correlation Summary
| Measurement | Immigrants from Somalia | Immigrants from West Indies |
| Minimum | 79.5% | 93.2% |
| Maximum | 100.0% | 100.0% |
| Range | 20.5% | 6.8% |
| Mean | 93.8% | 96.3% |
| Median | 95.0% | 95.1% |
| Interquartile 25% (IQ1) | 92.9% | 93.9% |
| Interquartile 75% (IQ3) | 96.1% | 98.7% |
| Interquartile Range (IQR) | 3.2% | 4.8% |
| Standard Deviation (Sample) | 4.1% | 2.5% |
| Standard Deviation (Population) | 4.1% | 2.4% |
Similar Demographics by 8th Grade
Demographics Similar to Immigrants from Somalia by 8th Grade
In terms of 8th grade, the demographic groups most similar to Immigrants from Somalia are Colombian (95.0%, a difference of 0.010%), Immigrants from Cameroon (95.0%, a difference of 0.020%), Afghan (94.9%, a difference of 0.020%), Immigrants from Congo (94.9%, a difference of 0.030%), and Ghanaian (94.9%, a difference of 0.030%).
| Demographics | Rating | Rank | 8th Grade |
| Uruguayans | 1.2 /100 | #248 | Tragic 95.1% |
| Immigrants | China | 1.1 /100 | #249 | Tragic 95.0% |
| Koreans | 1.1 /100 | #250 | Tragic 95.0% |
| Bolivians | 1.0 /100 | #251 | Tragic 95.0% |
| Immigrants | Ethiopia | 1.0 /100 | #252 | Tragic 95.0% |
| U.S. Virgin Islanders | 0.9 /100 | #253 | Tragic 95.0% |
| Immigrants | Cameroon | 0.8 /100 | #254 | Tragic 95.0% |
| Immigrants | Somalia | 0.7 /100 | #255 | Tragic 95.0% |
| Colombians | 0.7 /100 | #256 | Tragic 95.0% |
| Afghans | 0.6 /100 | #257 | Tragic 94.9% |
| Immigrants | Congo | 0.6 /100 | #258 | Tragic 94.9% |
| Ghanaians | 0.6 /100 | #259 | Tragic 94.9% |
| Immigrants | Jamaica | 0.6 /100 | #260 | Tragic 94.9% |
| Immigrants | Costa Rica | 0.5 /100 | #261 | Tragic 94.9% |
| Immigrants | Nigeria | 0.4 /100 | #262 | Tragic 94.9% |
Demographics Similar to Immigrants from West Indies by 8th Grade
In terms of 8th grade, the demographic groups most similar to Immigrants from West Indies are Immigrants from Grenada (94.3%, a difference of 0.010%), British West Indian (94.4%, a difference of 0.070%), Bangladeshi (94.3%, a difference of 0.080%), Yaqui (94.2%, a difference of 0.11%), and Houma (94.2%, a difference of 0.12%).
| Demographics | Rating | Rank | 8th Grade |
| Immigrants | St. Vincent and the Grenadines | 0.1 /100 | #283 | Tragic 94.6% |
| Immigrants | Philippines | 0.1 /100 | #284 | Tragic 94.6% |
| Immigrants | Barbados | 0.0 /100 | #285 | Tragic 94.5% |
| Immigrants | Peru | 0.0 /100 | #286 | Tragic 94.5% |
| Tohono O'odham | 0.0 /100 | #287 | Tragic 94.5% |
| Malaysians | 0.0 /100 | #288 | Tragic 94.5% |
| British West Indians | 0.0 /100 | #289 | Tragic 94.4% |
| Immigrants | West Indies | 0.0 /100 | #290 | Tragic 94.3% |
| Immigrants | Grenada | 0.0 /100 | #291 | Tragic 94.3% |
| Bangladeshis | 0.0 /100 | #292 | Tragic 94.3% |
| Yaqui | 0.0 /100 | #293 | Tragic 94.2% |
| Houma | 0.0 /100 | #294 | Tragic 94.2% |
| Fijians | 0.0 /100 | #295 | Tragic 94.2% |
| Haitians | 0.0 /100 | #296 | Tragic 94.2% |
| Immigrants | South Eastern Asia | 0.0 /100 | #297 | Tragic 94.2% |