Immigrants from Somalia vs Ethiopian 10th Grade
COMPARE
Immigrants from Somalia
Ethiopian
10th Grade
10th Grade Comparison
Immigrants from Somalia
Ethiopians
93.0%
10TH GRADE
2.7/ 100
METRIC RATING
241st/ 347
METRIC RANK
93.2%
10TH GRADE
7.9/ 100
METRIC RATING
222nd/ 347
METRIC RANK
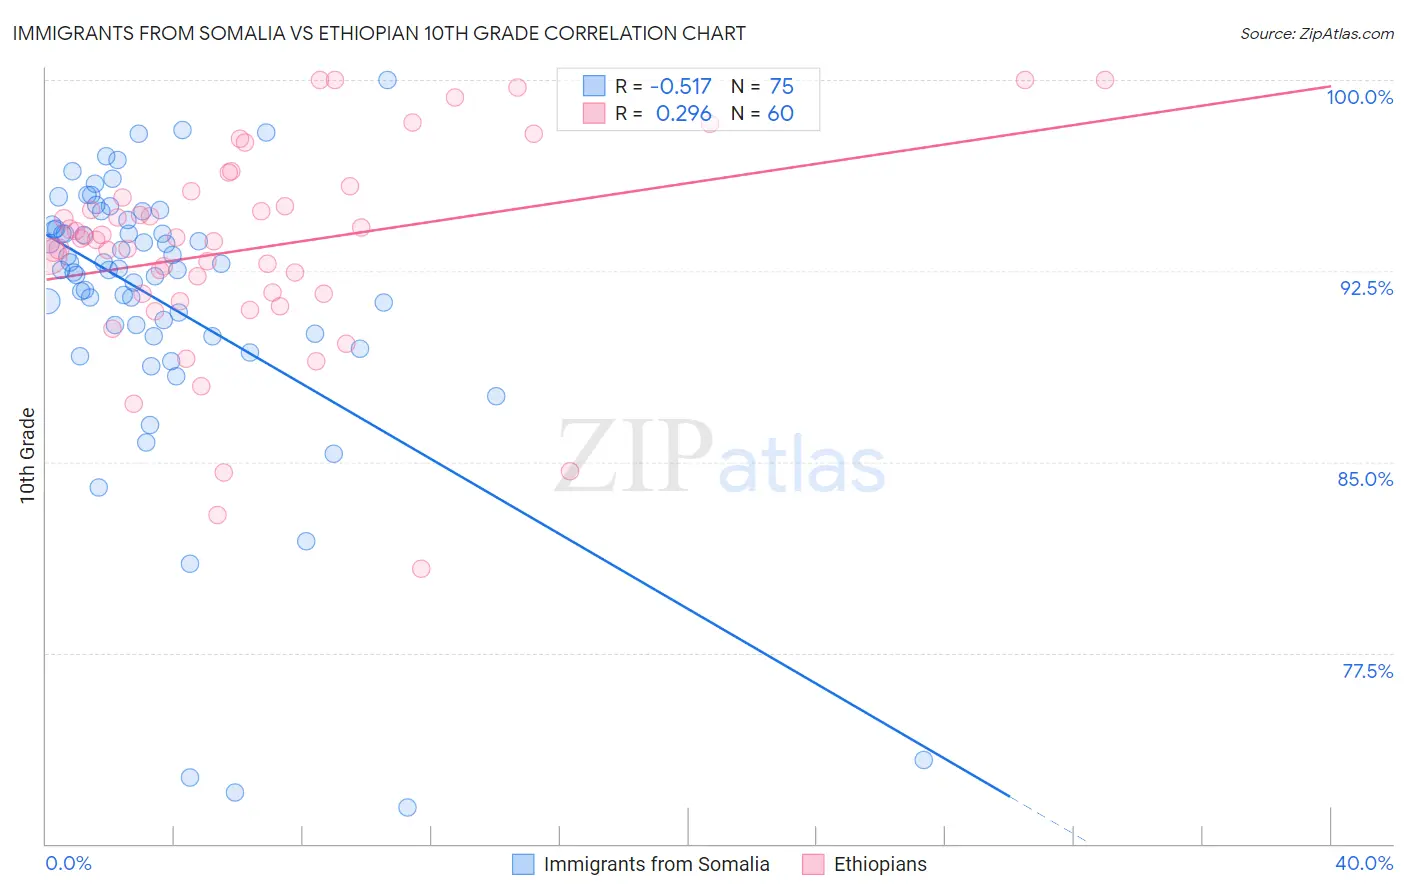
Immigrants from Somalia vs Ethiopian 10th Grade Correlation Chart
The statistical analysis conducted on geographies consisting of 92,101,093 people shows a substantial negative correlation between the proportion of Immigrants from Somalia and percentage of population with at least 10th grade education in the United States with a correlation coefficient (R) of -0.517 and weighted average of 93.0%. Similarly, the statistical analysis conducted on geographies consisting of 223,161,778 people shows a weak positive correlation between the proportion of Ethiopians and percentage of population with at least 10th grade education in the United States with a correlation coefficient (R) of 0.296 and weighted average of 93.2%, a difference of 0.26%.
10th Grade Correlation Summary
| Measurement | Immigrants from Somalia | Ethiopian |
| Minimum | 71.4% | 80.8% |
| Maximum | 100.0% | 100.0% |
| Range | 28.6% | 19.2% |
| Mean | 91.2% | 93.4% |
| Median | 92.6% | 93.7% |
| Interquartile 25% (IQ1) | 89.9% | 91.6% |
| Interquartile 75% (IQ3) | 94.3% | 95.5% |
| Interquartile Range (IQR) | 4.3% | 3.9% |
| Standard Deviation (Sample) | 5.7% | 4.1% |
| Standard Deviation (Population) | 5.7% | 4.1% |
Demographics Similar to Immigrants from Somalia and Ethiopians by 10th Grade
In terms of 10th grade, the demographic groups most similar to Immigrants from Somalia are Immigrants from Hong Kong (93.1%, a difference of 0.10%), Immigrants from Panama (93.1%, a difference of 0.11%), Nigerian (93.1%, a difference of 0.11%), Costa Rican (93.1%, a difference of 0.11%), and Subsaharan African (93.1%, a difference of 0.13%). Similarly, the demographic groups most similar to Ethiopians are Immigrants from Sierra Leone (93.2%, a difference of 0.010%), Immigrants from Southern Europe (93.2%, a difference of 0.030%), Bolivian (93.2%, a difference of 0.040%), Somali (93.2%, a difference of 0.060%), and Korean (93.2%, a difference of 0.060%).
| Demographics | Rating | Rank | 10th Grade |
| Immigrants | Southern Europe | 8.9 /100 | #221 | Tragic 93.2% |
| Ethiopians | 7.9 /100 | #222 | Tragic 93.2% |
| Immigrants | Sierra Leone | 7.6 /100 | #223 | Tragic 93.2% |
| Bolivians | 6.7 /100 | #224 | Tragic 93.2% |
| Somalis | 6.2 /100 | #225 | Tragic 93.2% |
| Koreans | 6.1 /100 | #226 | Tragic 93.2% |
| Blacks/African Americans | 6.0 /100 | #227 | Tragic 93.2% |
| Immigrants | China | 5.9 /100 | #228 | Tragic 93.2% |
| Immigrants | Ethiopia | 5.1 /100 | #229 | Tragic 93.1% |
| Immigrants | Africa | 5.0 /100 | #230 | Tragic 93.1% |
| South American Indians | 4.9 /100 | #231 | Tragic 93.1% |
| Bahamians | 4.9 /100 | #232 | Tragic 93.1% |
| Comanche | 4.9 /100 | #233 | Tragic 93.1% |
| Sub-Saharan Africans | 4.7 /100 | #234 | Tragic 93.1% |
| Africans | 4.6 /100 | #235 | Tragic 93.1% |
| Afghans | 4.5 /100 | #236 | Tragic 93.1% |
| Immigrants | Panama | 4.3 /100 | #237 | Tragic 93.1% |
| Nigerians | 4.2 /100 | #238 | Tragic 93.1% |
| Costa Ricans | 4.2 /100 | #239 | Tragic 93.1% |
| Immigrants | Hong Kong | 4.2 /100 | #240 | Tragic 93.1% |
| Immigrants | Somalia | 2.7 /100 | #241 | Tragic 93.0% |