Immigrants from Somalia vs Cambodian 10th Grade
COMPARE
Immigrants from Somalia
Cambodian
10th Grade
10th Grade Comparison
Immigrants from Somalia
Cambodians
93.0%
10TH GRADE
2.7/ 100
METRIC RATING
241st/ 347
METRIC RANK
94.5%
10TH GRADE
97.6/ 100
METRIC RATING
102nd/ 347
METRIC RANK
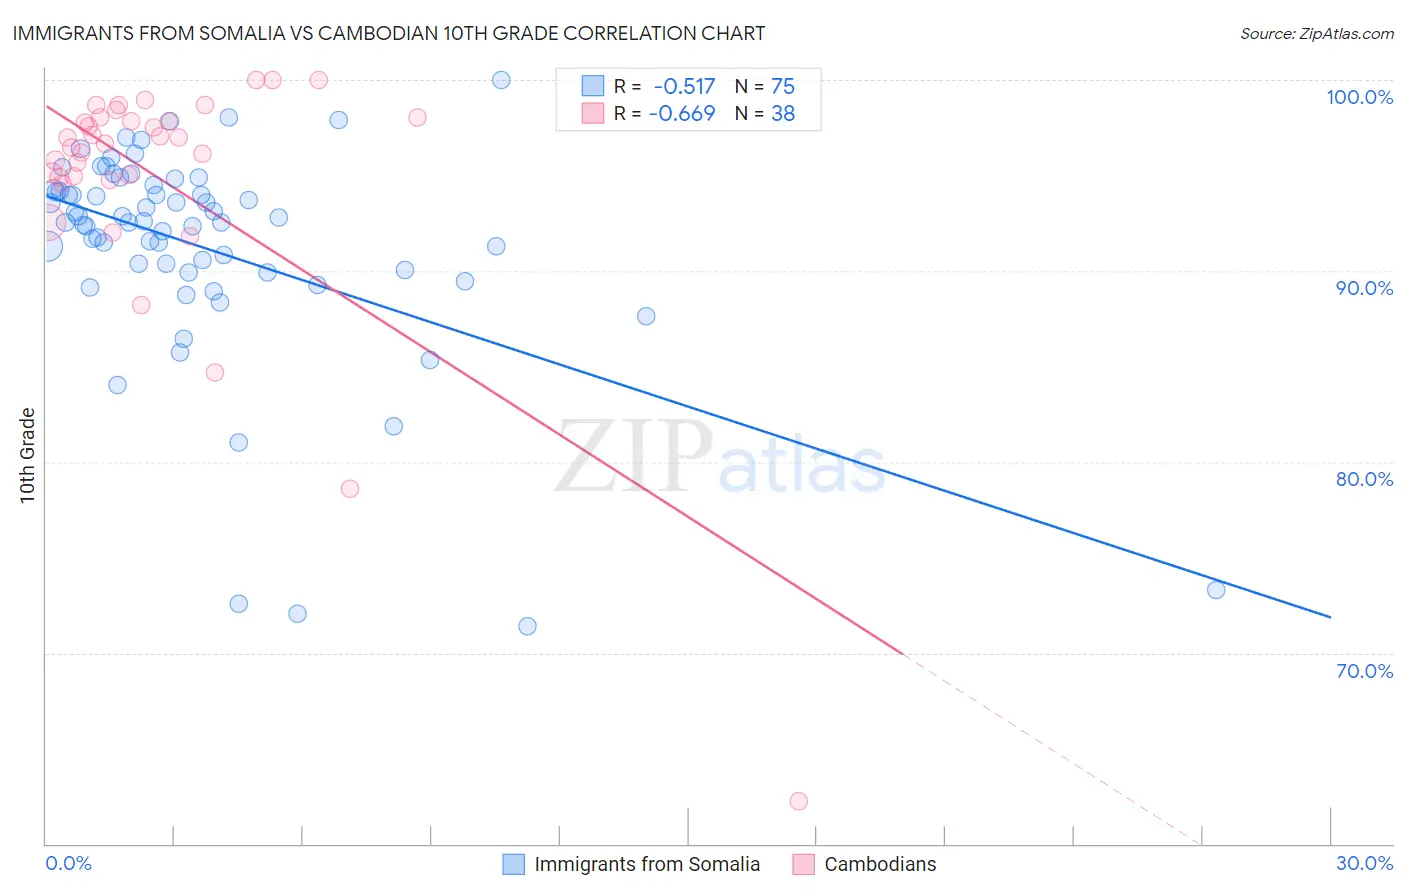
Immigrants from Somalia vs Cambodian 10th Grade Correlation Chart
The statistical analysis conducted on geographies consisting of 92,101,093 people shows a substantial negative correlation between the proportion of Immigrants from Somalia and percentage of population with at least 10th grade education in the United States with a correlation coefficient (R) of -0.517 and weighted average of 93.0%. Similarly, the statistical analysis conducted on geographies consisting of 102,514,976 people shows a significant negative correlation between the proportion of Cambodians and percentage of population with at least 10th grade education in the United States with a correlation coefficient (R) of -0.669 and weighted average of 94.5%, a difference of 1.7%.
10th Grade Correlation Summary
| Measurement | Immigrants from Somalia | Cambodian |
| Minimum | 71.4% | 62.2% |
| Maximum | 100.0% | 100.0% |
| Range | 28.6% | 37.8% |
| Mean | 91.2% | 94.8% |
| Median | 92.6% | 96.8% |
| Interquartile 25% (IQ1) | 89.9% | 94.9% |
| Interquartile 75% (IQ3) | 94.3% | 98.0% |
| Interquartile Range (IQR) | 4.3% | 3.1% |
| Standard Deviation (Sample) | 5.7% | 6.9% |
| Standard Deviation (Population) | 5.7% | 6.8% |
Similar Demographics by 10th Grade
Demographics Similar to Immigrants from Somalia by 10th Grade
In terms of 10th grade, the demographic groups most similar to Immigrants from Somalia are Immigrants from Cameroon (93.0%, a difference of 0.0%), Senegalese (93.0%, a difference of 0.030%), Spanish American (92.9%, a difference of 0.060%), Uruguayan (92.9%, a difference of 0.080%), and Immigrants from Hong Kong (93.1%, a difference of 0.10%).
| Demographics | Rating | Rank | 10th Grade |
| Sub-Saharan Africans | 4.7 /100 | #234 | Tragic 93.1% |
| Africans | 4.6 /100 | #235 | Tragic 93.1% |
| Afghans | 4.5 /100 | #236 | Tragic 93.1% |
| Immigrants | Panama | 4.3 /100 | #237 | Tragic 93.1% |
| Nigerians | 4.2 /100 | #238 | Tragic 93.1% |
| Costa Ricans | 4.2 /100 | #239 | Tragic 93.1% |
| Immigrants | Hong Kong | 4.2 /100 | #240 | Tragic 93.1% |
| Immigrants | Somalia | 2.7 /100 | #241 | Tragic 93.0% |
| Immigrants | Cameroon | 2.6 /100 | #242 | Tragic 93.0% |
| Senegalese | 2.4 /100 | #243 | Tragic 93.0% |
| Spanish Americans | 2.1 /100 | #244 | Tragic 92.9% |
| Uruguayans | 1.8 /100 | #245 | Tragic 92.9% |
| Immigrants | Middle Africa | 1.7 /100 | #246 | Tragic 92.9% |
| Immigrants | Afghanistan | 1.4 /100 | #247 | Tragic 92.8% |
| Colombians | 1.4 /100 | #248 | Tragic 92.8% |
Demographics Similar to Cambodians by 10th Grade
In terms of 10th grade, the demographic groups most similar to Cambodians are Immigrants from South Central Asia (94.5%, a difference of 0.010%), Syrian (94.5%, a difference of 0.010%), Immigrants from Europe (94.5%, a difference of 0.020%), Immigrants from Romania (94.5%, a difference of 0.020%), and Immigrants from Turkey (94.5%, a difference of 0.020%).
| Demographics | Rating | Rank | 10th Grade |
| Menominee | 98.3 /100 | #95 | Exceptional 94.6% |
| Immigrants | Switzerland | 98.3 /100 | #96 | Exceptional 94.6% |
| Lebanese | 98.3 /100 | #97 | Exceptional 94.6% |
| Immigrants | Bulgaria | 98.1 /100 | #98 | Exceptional 94.6% |
| Immigrants | France | 97.9 /100 | #99 | Exceptional 94.5% |
| Immigrants | South Central Asia | 97.8 /100 | #100 | Exceptional 94.5% |
| Syrians | 97.7 /100 | #101 | Exceptional 94.5% |
| Cambodians | 97.6 /100 | #102 | Exceptional 94.5% |
| Immigrants | Europe | 97.5 /100 | #103 | Exceptional 94.5% |
| Immigrants | Romania | 97.5 /100 | #104 | Exceptional 94.5% |
| Immigrants | Turkey | 97.4 /100 | #105 | Exceptional 94.5% |
| Immigrants | Serbia | 97.4 /100 | #106 | Exceptional 94.5% |
| Immigrants | Croatia | 97.4 /100 | #107 | Exceptional 94.5% |
| Immigrants | North Macedonia | 97.2 /100 | #108 | Exceptional 94.5% |
| Immigrants | Norway | 97.2 /100 | #109 | Exceptional 94.5% |