Dutch West Indian vs Ethiopian 10th Grade
COMPARE
Dutch West Indian
Ethiopian
10th Grade
10th Grade Comparison
Dutch West Indians
Ethiopians
92.6%
10TH GRADE
0.4/ 100
METRIC RATING
265th/ 347
METRIC RANK
93.2%
10TH GRADE
7.9/ 100
METRIC RATING
222nd/ 347
METRIC RANK
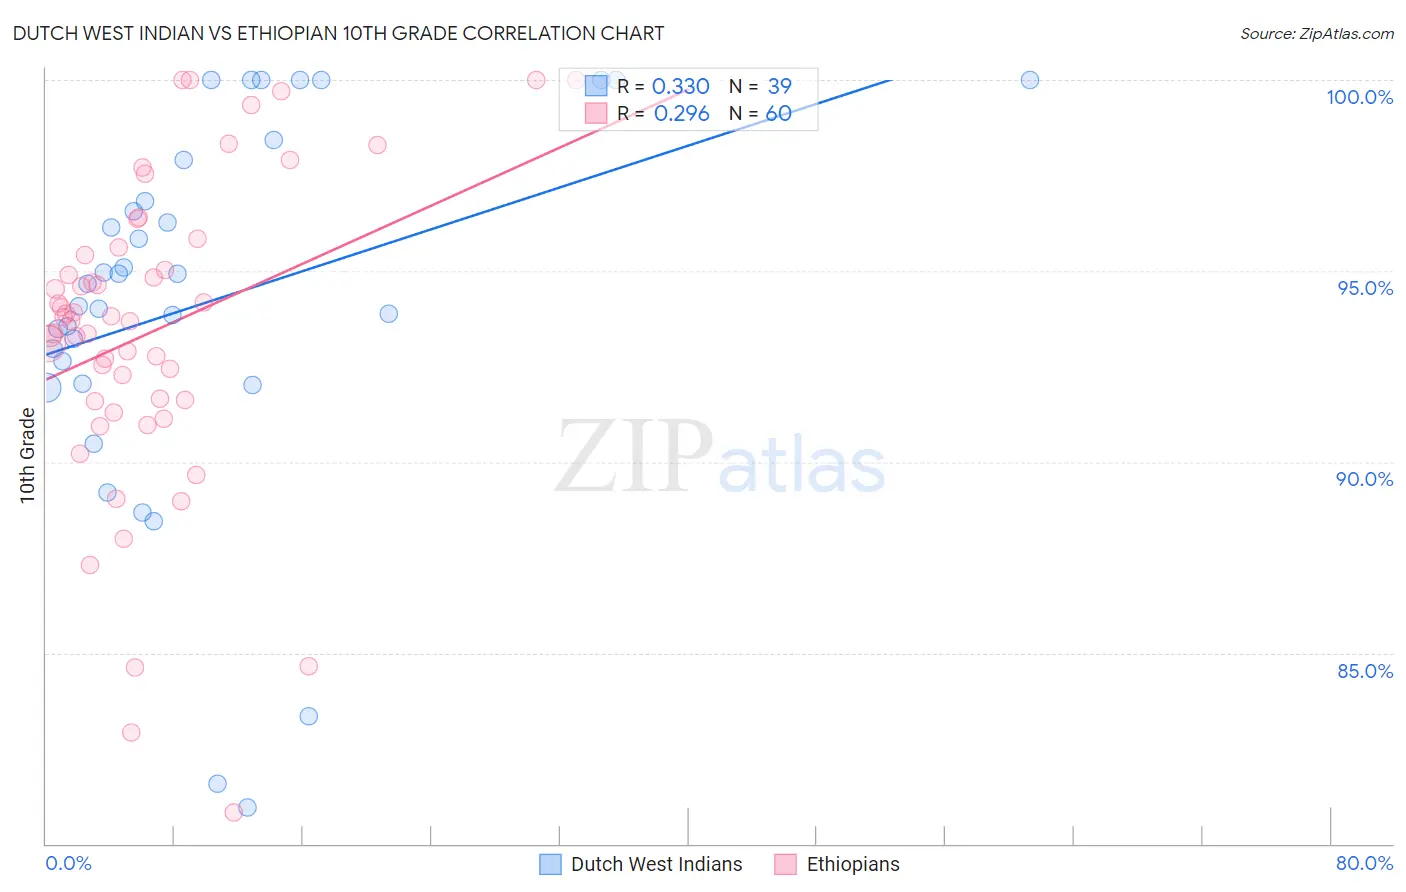
Dutch West Indian vs Ethiopian 10th Grade Correlation Chart
The statistical analysis conducted on geographies consisting of 85,776,122 people shows a mild positive correlation between the proportion of Dutch West Indians and percentage of population with at least 10th grade education in the United States with a correlation coefficient (R) of 0.330 and weighted average of 92.6%. Similarly, the statistical analysis conducted on geographies consisting of 223,161,778 people shows a weak positive correlation between the proportion of Ethiopians and percentage of population with at least 10th grade education in the United States with a correlation coefficient (R) of 0.296 and weighted average of 93.2%, a difference of 0.71%.
10th Grade Correlation Summary
| Measurement | Dutch West Indian | Ethiopian |
| Minimum | 81.0% | 80.8% |
| Maximum | 100.0% | 100.0% |
| Range | 19.0% | 19.2% |
| Mean | 94.2% | 93.4% |
| Median | 94.7% | 93.7% |
| Interquartile 25% (IQ1) | 92.0% | 91.6% |
| Interquartile 75% (IQ3) | 97.9% | 95.5% |
| Interquartile Range (IQR) | 5.9% | 3.9% |
| Standard Deviation (Sample) | 4.9% | 4.1% |
| Standard Deviation (Population) | 4.8% | 4.1% |
Similar Demographics by 10th Grade
Demographics Similar to Dutch West Indians by 10th Grade
In terms of 10th grade, the demographic groups most similar to Dutch West Indians are Immigrants from Philippines (92.6%, a difference of 0.0%), Taiwanese (92.5%, a difference of 0.010%), Immigrants from Ghana (92.5%, a difference of 0.010%), Immigrants from South America (92.6%, a difference of 0.030%), and Apache (92.6%, a difference of 0.030%).
| Demographics | Rating | Rank | 10th Grade |
| Immigrants | Costa Rica | 0.6 /100 | #258 | Tragic 92.7% |
| Immigrants | Jamaica | 0.5 /100 | #259 | Tragic 92.6% |
| Immigrants | Uzbekistan | 0.5 /100 | #260 | Tragic 92.6% |
| Paiute | 0.4 /100 | #261 | Tragic 92.6% |
| Immigrants | South America | 0.4 /100 | #262 | Tragic 92.6% |
| Apache | 0.4 /100 | #263 | Tragic 92.6% |
| Peruvians | 0.4 /100 | #264 | Tragic 92.6% |
| Dutch West Indians | 0.4 /100 | #265 | Tragic 92.6% |
| Immigrants | Philippines | 0.4 /100 | #266 | Tragic 92.6% |
| Taiwanese | 0.3 /100 | #267 | Tragic 92.5% |
| Immigrants | Ghana | 0.3 /100 | #268 | Tragic 92.5% |
| Immigrants | Colombia | 0.3 /100 | #269 | Tragic 92.5% |
| Immigrants | Uruguay | 0.3 /100 | #270 | Tragic 92.5% |
| Immigrants | Eritrea | 0.3 /100 | #271 | Tragic 92.5% |
| Immigrants | Western Africa | 0.3 /100 | #272 | Tragic 92.5% |
Demographics Similar to Ethiopians by 10th Grade
In terms of 10th grade, the demographic groups most similar to Ethiopians are Immigrants from Sierra Leone (93.2%, a difference of 0.010%), Immigrants from Southern Europe (93.2%, a difference of 0.030%), Bolivian (93.2%, a difference of 0.040%), Tongan (93.3%, a difference of 0.050%), and Seminole (93.3%, a difference of 0.060%).
| Demographics | Rating | Rank | 10th Grade |
| Immigrants | Oceania | 15.1 /100 | #215 | Poor 93.4% |
| Immigrants | Eastern Africa | 14.7 /100 | #216 | Poor 93.4% |
| Portuguese | 12.1 /100 | #217 | Poor 93.3% |
| Immigrants | Liberia | 10.2 /100 | #218 | Poor 93.3% |
| Seminole | 10.2 /100 | #219 | Poor 93.3% |
| Tongans | 9.5 /100 | #220 | Tragic 93.3% |
| Immigrants | Southern Europe | 8.9 /100 | #221 | Tragic 93.2% |
| Ethiopians | 7.9 /100 | #222 | Tragic 93.2% |
| Immigrants | Sierra Leone | 7.6 /100 | #223 | Tragic 93.2% |
| Bolivians | 6.7 /100 | #224 | Tragic 93.2% |
| Somalis | 6.2 /100 | #225 | Tragic 93.2% |
| Koreans | 6.1 /100 | #226 | Tragic 93.2% |
| Blacks/African Americans | 6.0 /100 | #227 | Tragic 93.2% |
| Immigrants | China | 5.9 /100 | #228 | Tragic 93.2% |
| Immigrants | Ethiopia | 5.1 /100 | #229 | Tragic 93.1% |