Immigrants from Somalia vs Ethiopian Cognitive Disability
COMPARE
Immigrants from Somalia
Ethiopian
Cognitive Disability
Cognitive Disability Comparison
Immigrants from Somalia
Ethiopians
20.0%
COGNITIVE DISABILITY
0.0/ 100
METRIC RATING
347th/ 347
METRIC RANK
17.9%
COGNITIVE DISABILITY
0.5/ 100
METRIC RATING
259th/ 347
METRIC RANK
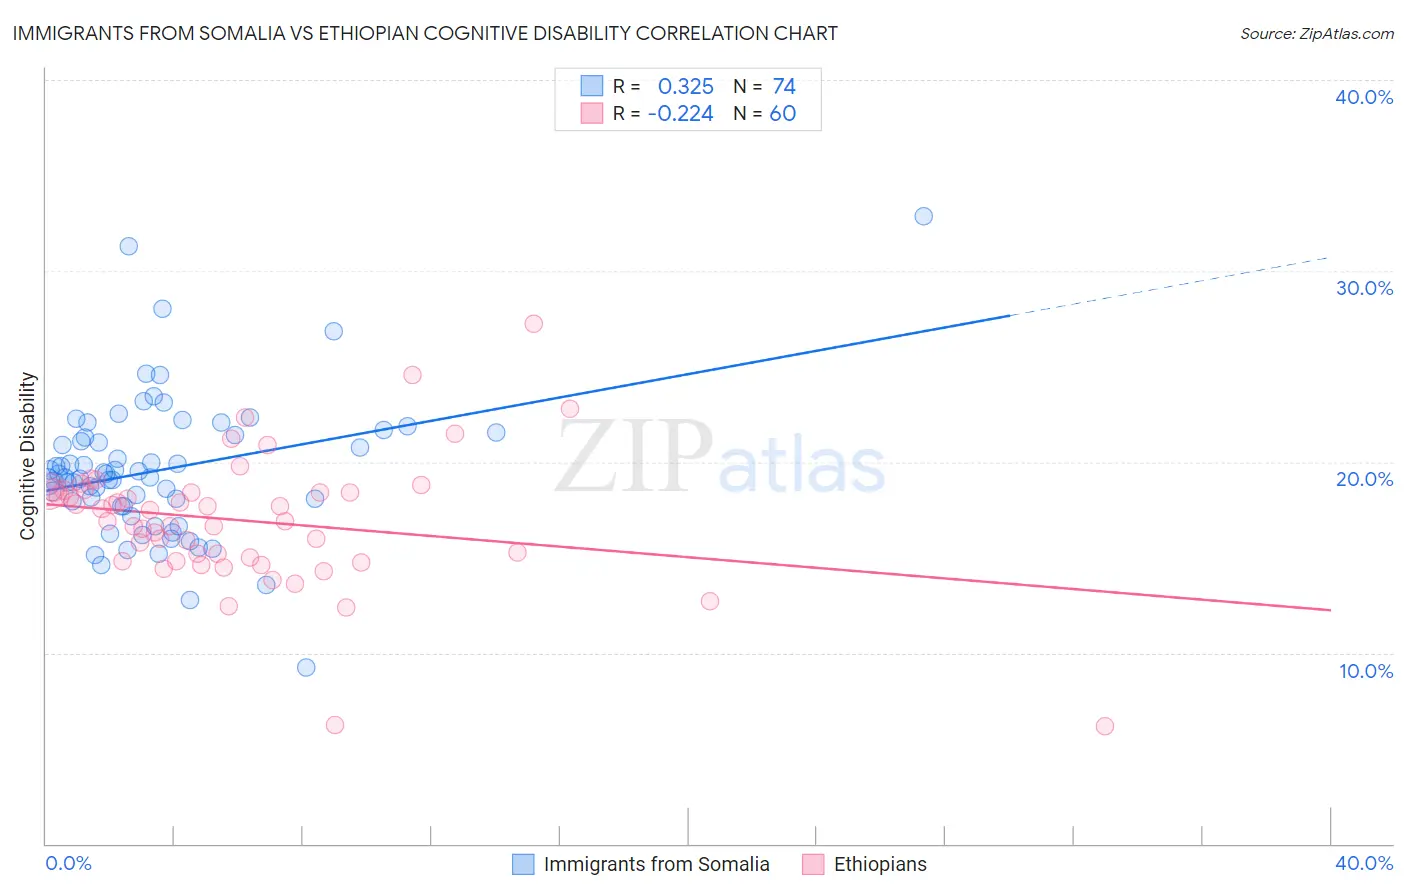
Immigrants from Somalia vs Ethiopian Cognitive Disability Correlation Chart
The statistical analysis conducted on geographies consisting of 92,095,793 people shows a mild positive correlation between the proportion of Immigrants from Somalia and percentage of population with cognitive disability in the United States with a correlation coefficient (R) of 0.325 and weighted average of 20.0%. Similarly, the statistical analysis conducted on geographies consisting of 223,243,402 people shows a weak negative correlation between the proportion of Ethiopians and percentage of population with cognitive disability in the United States with a correlation coefficient (R) of -0.224 and weighted average of 17.9%, a difference of 11.6%.
Cognitive Disability Correlation Summary
| Measurement | Immigrants from Somalia | Ethiopian |
| Minimum | 9.3% | 6.2% |
| Maximum | 32.8% | 27.2% |
| Range | 23.6% | 21.1% |
| Mean | 19.6% | 16.9% |
| Median | 19.3% | 17.2% |
| Interquartile 25% (IQ1) | 17.7% | 14.9% |
| Interquartile 75% (IQ3) | 21.4% | 18.5% |
| Interquartile Range (IQR) | 3.7% | 3.6% |
| Standard Deviation (Sample) | 3.7% | 3.5% |
| Standard Deviation (Population) | 3.7% | 3.4% |
Similar Demographics by Cognitive Disability
Demographics Similar to Immigrants from Somalia by Cognitive Disability
In terms of cognitive disability, the demographic groups most similar to Immigrants from Somalia are Immigrants from Cabo Verde (19.9%, a difference of 0.73%), Somali (19.8%, a difference of 0.89%), Immigrants from Congo (19.7%, a difference of 1.5%), Immigrants from Zaire (19.4%, a difference of 3.1%), and Tohono O'odham (19.3%, a difference of 3.8%).
| Demographics | Rating | Rank | Cognitive Disability |
| Immigrants | Yemen | 0.0 /100 | #333 | Tragic 18.8% |
| Sudanese | 0.0 /100 | #334 | Tragic 18.9% |
| Senegalese | 0.0 /100 | #335 | Tragic 19.0% |
| Blacks/African Americans | 0.0 /100 | #336 | Tragic 19.0% |
| Immigrants | Saudi Arabia | 0.0 /100 | #337 | Tragic 19.1% |
| Lumbee | 0.0 /100 | #338 | Tragic 19.1% |
| Puerto Ricans | 0.0 /100 | #339 | Tragic 19.2% |
| Cape Verdeans | 0.0 /100 | #340 | Tragic 19.2% |
| Tohono O'odham | 0.0 /100 | #341 | Tragic 19.3% |
| Houma | 0.0 /100 | #342 | Tragic 19.3% |
| Immigrants | Zaire | 0.0 /100 | #343 | Tragic 19.4% |
| Immigrants | Congo | 0.0 /100 | #344 | Tragic 19.7% |
| Somalis | 0.0 /100 | #345 | Tragic 19.8% |
| Immigrants | Cabo Verde | 0.0 /100 | #346 | Tragic 19.9% |
| Immigrants | Somalia | 0.0 /100 | #347 | Tragic 20.0% |
Demographics Similar to Ethiopians by Cognitive Disability
In terms of cognitive disability, the demographic groups most similar to Ethiopians are Immigrants from Belize (17.9%, a difference of 0.010%), Guamanian/Chamorro (17.9%, a difference of 0.060%), Immigrants from Armenia (17.9%, a difference of 0.080%), Mexican American Indian (17.9%, a difference of 0.090%), and Sierra Leonean (17.9%, a difference of 0.090%).
| Demographics | Rating | Rank | Cognitive Disability |
| Immigrants | Grenada | 0.6 /100 | #252 | Tragic 17.9% |
| Hopi | 0.6 /100 | #253 | Tragic 17.9% |
| Hispanics or Latinos | 0.6 /100 | #254 | Tragic 17.9% |
| Immigrants | Azores | 0.6 /100 | #255 | Tragic 17.9% |
| Bahamians | 0.6 /100 | #256 | Tragic 17.9% |
| Mexican American Indians | 0.6 /100 | #257 | Tragic 17.9% |
| Immigrants | Armenia | 0.6 /100 | #258 | Tragic 17.9% |
| Ethiopians | 0.5 /100 | #259 | Tragic 17.9% |
| Immigrants | Belize | 0.5 /100 | #260 | Tragic 17.9% |
| Guamanians/Chamorros | 0.5 /100 | #261 | Tragic 17.9% |
| Sierra Leoneans | 0.4 /100 | #262 | Tragic 17.9% |
| Immigrants | Barbados | 0.4 /100 | #263 | Tragic 17.9% |
| Menominee | 0.4 /100 | #264 | Tragic 18.0% |
| Spanish Americans | 0.4 /100 | #265 | Tragic 18.0% |
| Belizeans | 0.4 /100 | #266 | Tragic 18.0% |