Immigrants from Somalia vs Immigrants from Africa 10th Grade
COMPARE
Immigrants from Somalia
Immigrants from Africa
10th Grade
10th Grade Comparison
Immigrants from Somalia
Immigrants from Africa
93.0%
10TH GRADE
2.7/ 100
METRIC RATING
241st/ 347
METRIC RANK
93.1%
10TH GRADE
5.0/ 100
METRIC RATING
230th/ 347
METRIC RANK
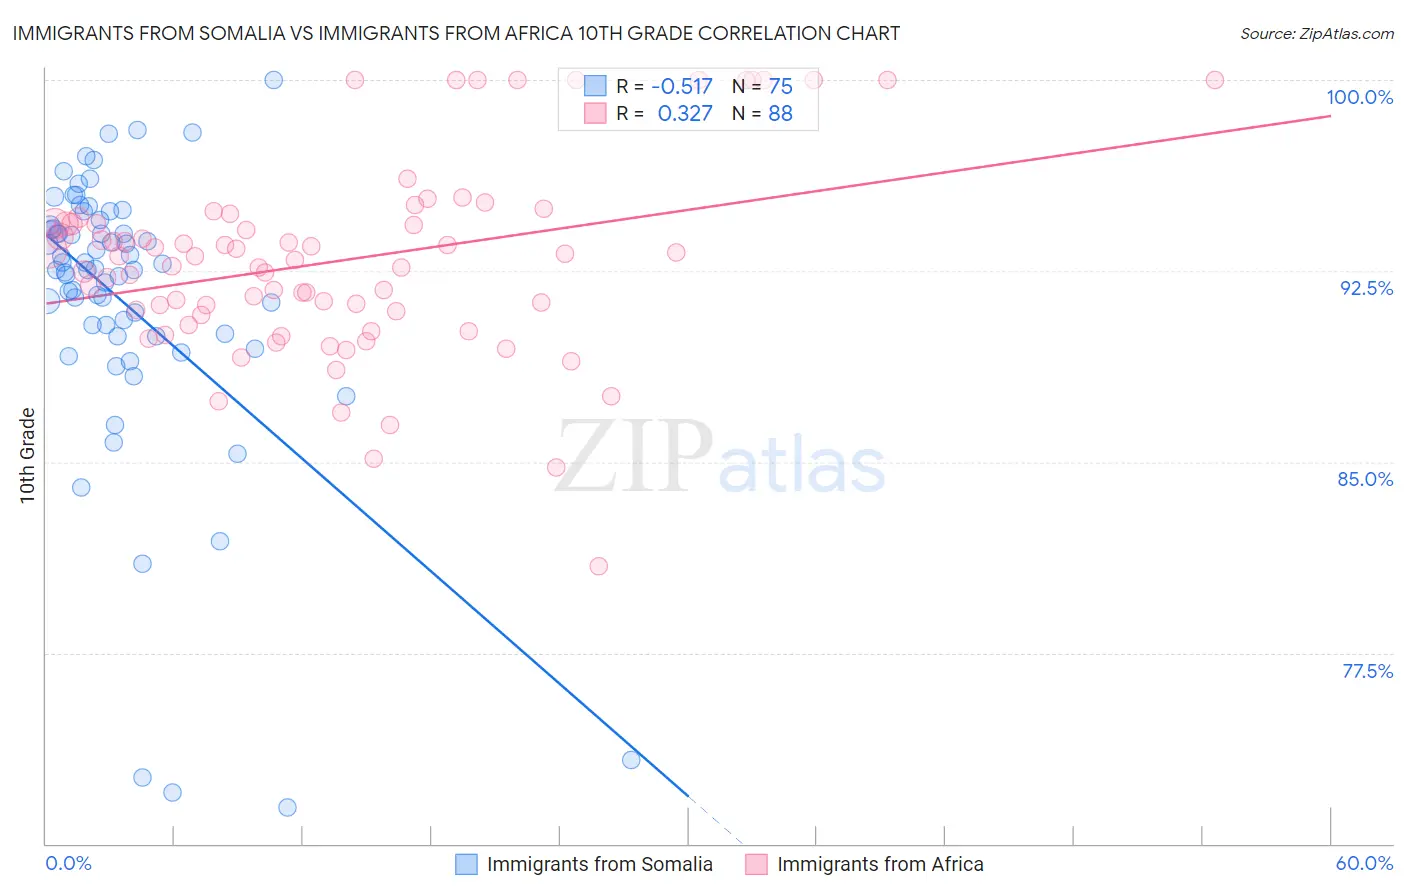
Immigrants from Somalia vs Immigrants from Africa 10th Grade Correlation Chart
The statistical analysis conducted on geographies consisting of 92,101,093 people shows a substantial negative correlation between the proportion of Immigrants from Somalia and percentage of population with at least 10th grade education in the United States with a correlation coefficient (R) of -0.517 and weighted average of 93.0%. Similarly, the statistical analysis conducted on geographies consisting of 469,408,495 people shows a mild positive correlation between the proportion of Immigrants from Africa and percentage of population with at least 10th grade education in the United States with a correlation coefficient (R) of 0.327 and weighted average of 93.1%, a difference of 0.15%.
10th Grade Correlation Summary
| Measurement | Immigrants from Somalia | Immigrants from Africa |
| Minimum | 71.4% | 80.9% |
| Maximum | 100.0% | 100.0% |
| Range | 28.6% | 19.1% |
| Mean | 91.2% | 92.9% |
| Median | 92.6% | 93.0% |
| Interquartile 25% (IQ1) | 89.9% | 90.8% |
| Interquartile 75% (IQ3) | 94.3% | 94.4% |
| Interquartile Range (IQR) | 4.3% | 3.5% |
| Standard Deviation (Sample) | 5.7% | 3.8% |
| Standard Deviation (Population) | 5.7% | 3.8% |
Demographics Similar to Immigrants from Somalia and Immigrants from Africa by 10th Grade
In terms of 10th grade, the demographic groups most similar to Immigrants from Somalia are Immigrants from Cameroon (93.0%, a difference of 0.0%), Senegalese (93.0%, a difference of 0.030%), Spanish American (92.9%, a difference of 0.060%), Uruguayan (92.9%, a difference of 0.080%), and Immigrants from Hong Kong (93.1%, a difference of 0.10%). Similarly, the demographic groups most similar to Immigrants from Africa are Immigrants from Ethiopia (93.1%, a difference of 0.0%), South American Indian (93.1%, a difference of 0.010%), Bahamian (93.1%, a difference of 0.010%), Comanche (93.1%, a difference of 0.010%), and Subsaharan African (93.1%, a difference of 0.020%).
| Demographics | Rating | Rank | 10th Grade |
| Somalis | 6.2 /100 | #225 | Tragic 93.2% |
| Koreans | 6.1 /100 | #226 | Tragic 93.2% |
| Blacks/African Americans | 6.0 /100 | #227 | Tragic 93.2% |
| Immigrants | China | 5.9 /100 | #228 | Tragic 93.2% |
| Immigrants | Ethiopia | 5.1 /100 | #229 | Tragic 93.1% |
| Immigrants | Africa | 5.0 /100 | #230 | Tragic 93.1% |
| South American Indians | 4.9 /100 | #231 | Tragic 93.1% |
| Bahamians | 4.9 /100 | #232 | Tragic 93.1% |
| Comanche | 4.9 /100 | #233 | Tragic 93.1% |
| Sub-Saharan Africans | 4.7 /100 | #234 | Tragic 93.1% |
| Africans | 4.6 /100 | #235 | Tragic 93.1% |
| Afghans | 4.5 /100 | #236 | Tragic 93.1% |
| Immigrants | Panama | 4.3 /100 | #237 | Tragic 93.1% |
| Nigerians | 4.2 /100 | #238 | Tragic 93.1% |
| Costa Ricans | 4.2 /100 | #239 | Tragic 93.1% |
| Immigrants | Hong Kong | 4.2 /100 | #240 | Tragic 93.1% |
| Immigrants | Somalia | 2.7 /100 | #241 | Tragic 93.0% |
| Immigrants | Cameroon | 2.6 /100 | #242 | Tragic 93.0% |
| Senegalese | 2.4 /100 | #243 | Tragic 93.0% |
| Spanish Americans | 2.1 /100 | #244 | Tragic 92.9% |
| Uruguayans | 1.8 /100 | #245 | Tragic 92.9% |