Immigrants from Singapore vs Native Hawaiian Associate's Degree
COMPARE
Immigrants from Singapore
Native Hawaiian
Associate's Degree
Associate's Degree Comparison
Immigrants from Singapore
Native Hawaiians
58.9%
ASSOCIATE'S DEGREE
100.0/ 100
METRIC RATING
2nd/ 347
METRIC RANK
43.1%
ASSOCIATE'S DEGREE
2.3/ 100
METRIC RATING
232nd/ 347
METRIC RANK
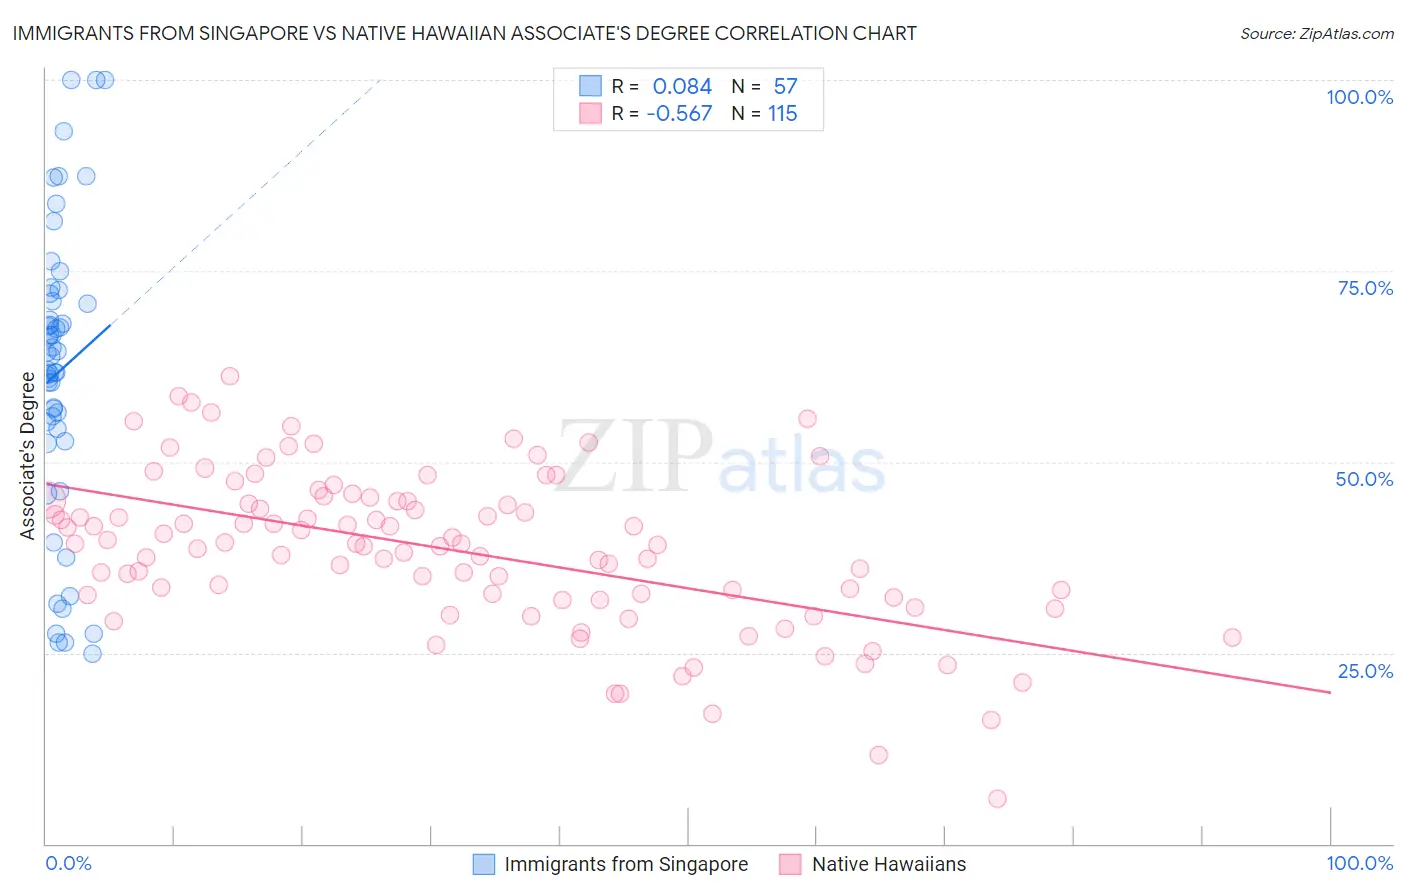
Immigrants from Singapore vs Native Hawaiian Associate's Degree Correlation Chart
The statistical analysis conducted on geographies consisting of 137,518,167 people shows a slight positive correlation between the proportion of Immigrants from Singapore and percentage of population with at least associate's degree education in the United States with a correlation coefficient (R) of 0.084 and weighted average of 58.9%. Similarly, the statistical analysis conducted on geographies consisting of 332,098,475 people shows a substantial negative correlation between the proportion of Native Hawaiians and percentage of population with at least associate's degree education in the United States with a correlation coefficient (R) of -0.567 and weighted average of 43.1%, a difference of 36.7%.
Associate's Degree Correlation Summary
| Measurement | Immigrants from Singapore | Native Hawaiian |
| Minimum | 24.9% | 5.9% |
| Maximum | 100.0% | 61.2% |
| Range | 75.1% | 55.3% |
| Mean | 61.8% | 38.4% |
| Median | 63.8% | 39.3% |
| Interquartile 25% (IQ1) | 53.5% | 32.3% |
| Interquartile 75% (IQ3) | 71.5% | 44.9% |
| Interquartile Range (IQR) | 18.1% | 12.6% |
| Standard Deviation (Sample) | 19.1% | 10.3% |
| Standard Deviation (Population) | 18.9% | 10.3% |
Similar Demographics by Associate's Degree
Demographics Similar to Immigrants from Singapore by Associate's Degree
In terms of associate's degree, the demographic groups most similar to Immigrants from Singapore are Immigrants from India (58.5%, a difference of 0.66%), Immigrants from Taiwan (58.4%, a difference of 0.91%), Iranian (58.2%, a difference of 1.3%), Filipino (59.8%, a difference of 1.5%), and Okinawan (57.7%, a difference of 2.2%).
| Demographics | Rating | Rank | Associate's Degree |
| Filipinos | 100.0 /100 | #1 | Exceptional 59.8% |
| Immigrants | Singapore | 100.0 /100 | #2 | Exceptional 58.9% |
| Immigrants | India | 100.0 /100 | #3 | Exceptional 58.5% |
| Immigrants | Taiwan | 100.0 /100 | #4 | Exceptional 58.4% |
| Iranians | 100.0 /100 | #5 | Exceptional 58.2% |
| Okinawans | 100.0 /100 | #6 | Exceptional 57.7% |
| Immigrants | Iran | 100.0 /100 | #7 | Exceptional 57.7% |
| Thais | 100.0 /100 | #8 | Exceptional 57.4% |
| Immigrants | Israel | 100.0 /100 | #9 | Exceptional 56.8% |
| Cypriots | 100.0 /100 | #10 | Exceptional 56.4% |
| Immigrants | Australia | 100.0 /100 | #11 | Exceptional 55.8% |
| Immigrants | South Central Asia | 100.0 /100 | #12 | Exceptional 55.7% |
| Immigrants | China | 100.0 /100 | #13 | Exceptional 55.5% |
| Immigrants | Hong Kong | 100.0 /100 | #14 | Exceptional 55.4% |
| Immigrants | Eastern Asia | 100.0 /100 | #15 | Exceptional 55.4% |
Demographics Similar to Native Hawaiians by Associate's Degree
In terms of associate's degree, the demographic groups most similar to Native Hawaiians are Tongan (43.0%, a difference of 0.16%), Tlingit-Haida (43.0%, a difference of 0.25%), Ecuadorian (43.0%, a difference of 0.35%), Immigrants from Barbados (43.3%, a difference of 0.43%), and Liberian (43.3%, a difference of 0.43%).
| Demographics | Rating | Rank | Associate's Degree |
| Guamanians/Chamorros | 4.8 /100 | #225 | Tragic 43.8% |
| Immigrants | Burma/Myanmar | 4.3 /100 | #226 | Tragic 43.7% |
| Trinidadians and Tobagonians | 4.0 /100 | #227 | Tragic 43.6% |
| Hmong | 3.2 /100 | #228 | Tragic 43.4% |
| Immigrants | Trinidad and Tobago | 3.0 /100 | #229 | Tragic 43.3% |
| Immigrants | Barbados | 2.9 /100 | #230 | Tragic 43.3% |
| Liberians | 2.9 /100 | #231 | Tragic 43.3% |
| Native Hawaiians | 2.3 /100 | #232 | Tragic 43.1% |
| Tongans | 2.2 /100 | #233 | Tragic 43.0% |
| Tlingit-Haida | 2.1 /100 | #234 | Tragic 43.0% |
| Ecuadorians | 2.0 /100 | #235 | Tragic 43.0% |
| Immigrants | St. Vincent and the Grenadines | 1.9 /100 | #236 | Tragic 42.9% |
| Immigrants | Nonimmigrants | 1.9 /100 | #237 | Tragic 42.9% |
| Iroquois | 1.7 /100 | #238 | Tragic 42.8% |
| Immigrants | Grenada | 1.3 /100 | #239 | Tragic 42.6% |