Immigrants from Singapore vs Malaysian Median Family Income
COMPARE
Immigrants from Singapore
Malaysian
Median Family Income
Median Family Income Comparison
Immigrants from Singapore
Malaysians
$134,818
MEDIAN FAMILY INCOME
100.0/ 100
METRIC RATING
3rd/ 347
METRIC RANK
$95,230
MEDIAN FAMILY INCOME
2.2/ 100
METRIC RATING
230th/ 347
METRIC RANK
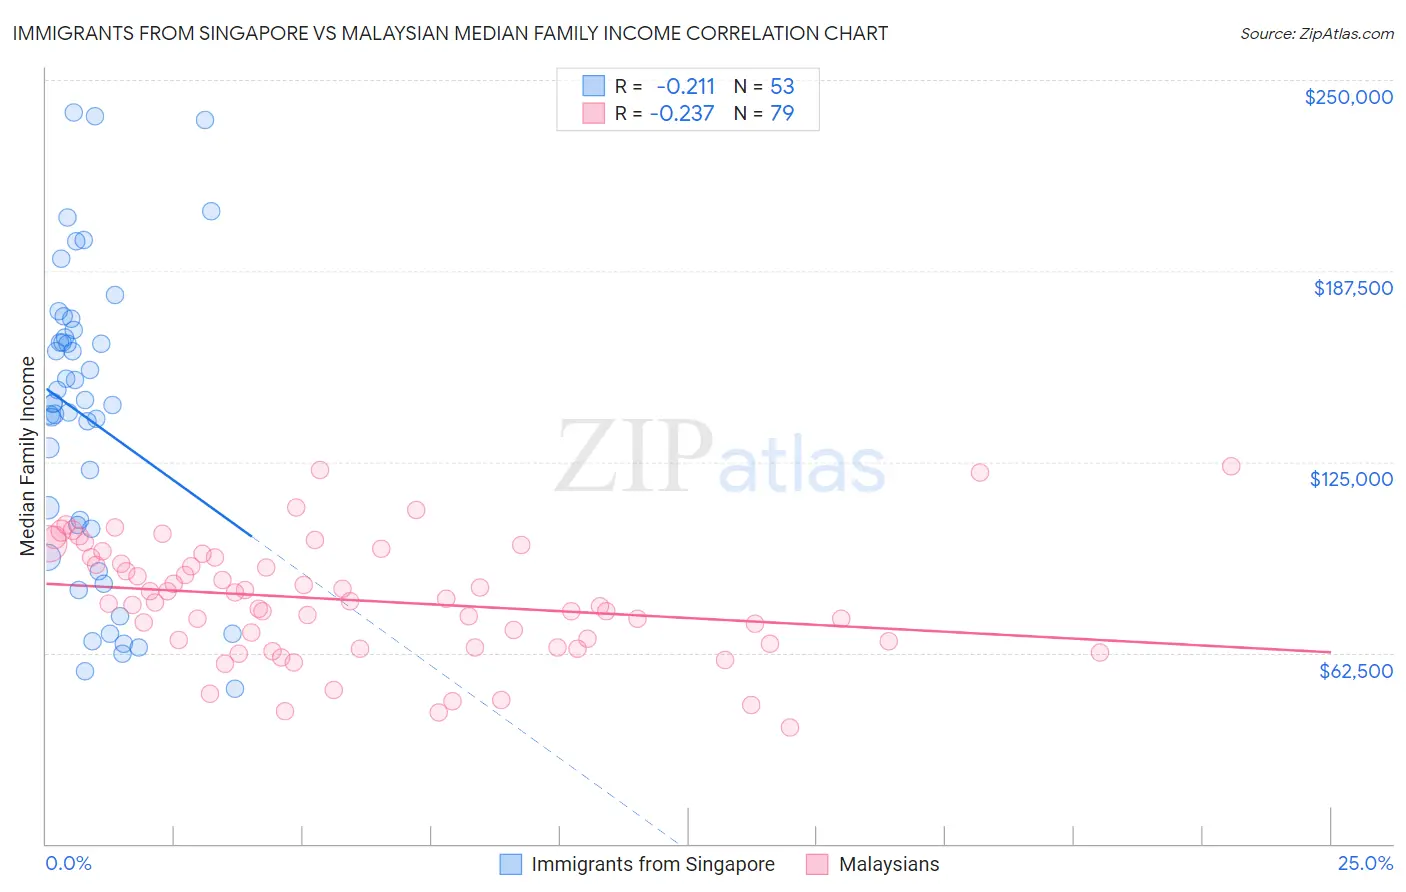
Immigrants from Singapore vs Malaysian Median Family Income Correlation Chart
The statistical analysis conducted on geographies consisting of 137,416,913 people shows a weak negative correlation between the proportion of Immigrants from Singapore and median family income in the United States with a correlation coefficient (R) of -0.211 and weighted average of $134,818. Similarly, the statistical analysis conducted on geographies consisting of 225,953,352 people shows a weak negative correlation between the proportion of Malaysians and median family income in the United States with a correlation coefficient (R) of -0.237 and weighted average of $95,230, a difference of 41.6%.
Median Family Income Correlation Summary
| Measurement | Immigrants from Singapore | Malaysian |
| Minimum | $50,694 | $38,021 |
| Maximum | $239,159 | $123,750 |
| Range | $188,465 | $85,729 |
| Mean | $138,690 | $79,701 |
| Median | $144,010 | $78,842 |
| Interquartile 25% (IQ1) | $98,407 | $65,625 |
| Interquartile 75% (IQ3) | $166,932 | $93,739 |
| Interquartile Range (IQR) | $68,525 | $28,114 |
| Standard Deviation (Sample) | $49,034 | $19,147 |
| Standard Deviation (Population) | $48,569 | $19,025 |
Similar Demographics by Median Family Income
Demographics Similar to Immigrants from Singapore by Median Family Income
In terms of median family income, the demographic groups most similar to Immigrants from Singapore are Immigrants from India ($134,028, a difference of 0.59%), Iranian ($133,839, a difference of 0.73%), Immigrants from Taiwan ($136,949, a difference of 1.6%), Filipino ($138,397, a difference of 2.6%), and Thai ($131,281, a difference of 2.7%).
| Demographics | Rating | Rank | Median Family Income |
| Filipinos | 100.0 /100 | #1 | Exceptional $138,397 |
| Immigrants | Taiwan | 100.0 /100 | #2 | Exceptional $136,949 |
| Immigrants | Singapore | 100.0 /100 | #3 | Exceptional $134,818 |
| Immigrants | India | 100.0 /100 | #4 | Exceptional $134,028 |
| Iranians | 100.0 /100 | #5 | Exceptional $133,839 |
| Thais | 100.0 /100 | #6 | Exceptional $131,281 |
| Immigrants | Hong Kong | 100.0 /100 | #7 | Exceptional $131,067 |
| Immigrants | Iran | 100.0 /100 | #8 | Exceptional $130,894 |
| Okinawans | 100.0 /100 | #9 | Exceptional $129,979 |
| Immigrants | Ireland | 100.0 /100 | #10 | Exceptional $127,584 |
| Immigrants | Israel | 100.0 /100 | #11 | Exceptional $127,430 |
| Cypriots | 100.0 /100 | #12 | Exceptional $127,064 |
| Immigrants | Australia | 100.0 /100 | #13 | Exceptional $126,620 |
| Immigrants | South Central Asia | 100.0 /100 | #14 | Exceptional $125,956 |
| Eastern Europeans | 100.0 /100 | #15 | Exceptional $125,546 |
Demographics Similar to Malaysians by Median Family Income
In terms of median family income, the demographic groups most similar to Malaysians are Marshallese ($95,293, a difference of 0.070%), Ecuadorian ($95,114, a difference of 0.12%), Immigrants from the Azores ($95,402, a difference of 0.18%), Immigrants from Venezuela ($94,904, a difference of 0.34%), and Alaska Native ($95,573, a difference of 0.36%).
| Demographics | Rating | Rank | Median Family Income |
| Venezuelans | 3.7 /100 | #223 | Tragic $96,281 |
| Immigrants | Nonimmigrants | 3.6 /100 | #224 | Tragic $96,231 |
| Vietnamese | 3.4 /100 | #225 | Tragic $96,123 |
| Immigrants | Panama | 2.7 /100 | #226 | Tragic $95,647 |
| Alaska Natives | 2.6 /100 | #227 | Tragic $95,573 |
| Immigrants | Azores | 2.4 /100 | #228 | Tragic $95,402 |
| Marshallese | 2.2 /100 | #229 | Tragic $95,293 |
| Malaysians | 2.2 /100 | #230 | Tragic $95,230 |
| Ecuadorians | 2.1 /100 | #231 | Tragic $95,114 |
| Immigrants | Venezuela | 1.9 /100 | #232 | Tragic $94,904 |
| Immigrants | Bangladesh | 1.6 /100 | #233 | Tragic $94,665 |
| Immigrants | Western Africa | 1.6 /100 | #234 | Tragic $94,638 |
| Immigrants | Burma/Myanmar | 1.5 /100 | #235 | Tragic $94,472 |
| Trinidadians and Tobagonians | 1.5 /100 | #236 | Tragic $94,466 |
| Alaskan Athabascans | 1.5 /100 | #237 | Tragic $94,429 |