Immigrants from Serbia vs Icelander Bachelor's Degree
COMPARE
Immigrants from Serbia
Icelander
Bachelor's Degree
Bachelor's Degree Comparison
Immigrants from Serbia
Icelanders
44.1%
BACHELOR'S DEGREE
99.9/ 100
METRIC RATING
56th/ 347
METRIC RANK
39.5%
BACHELOR'S DEGREE
86.5/ 100
METRIC RATING
137th/ 347
METRIC RANK
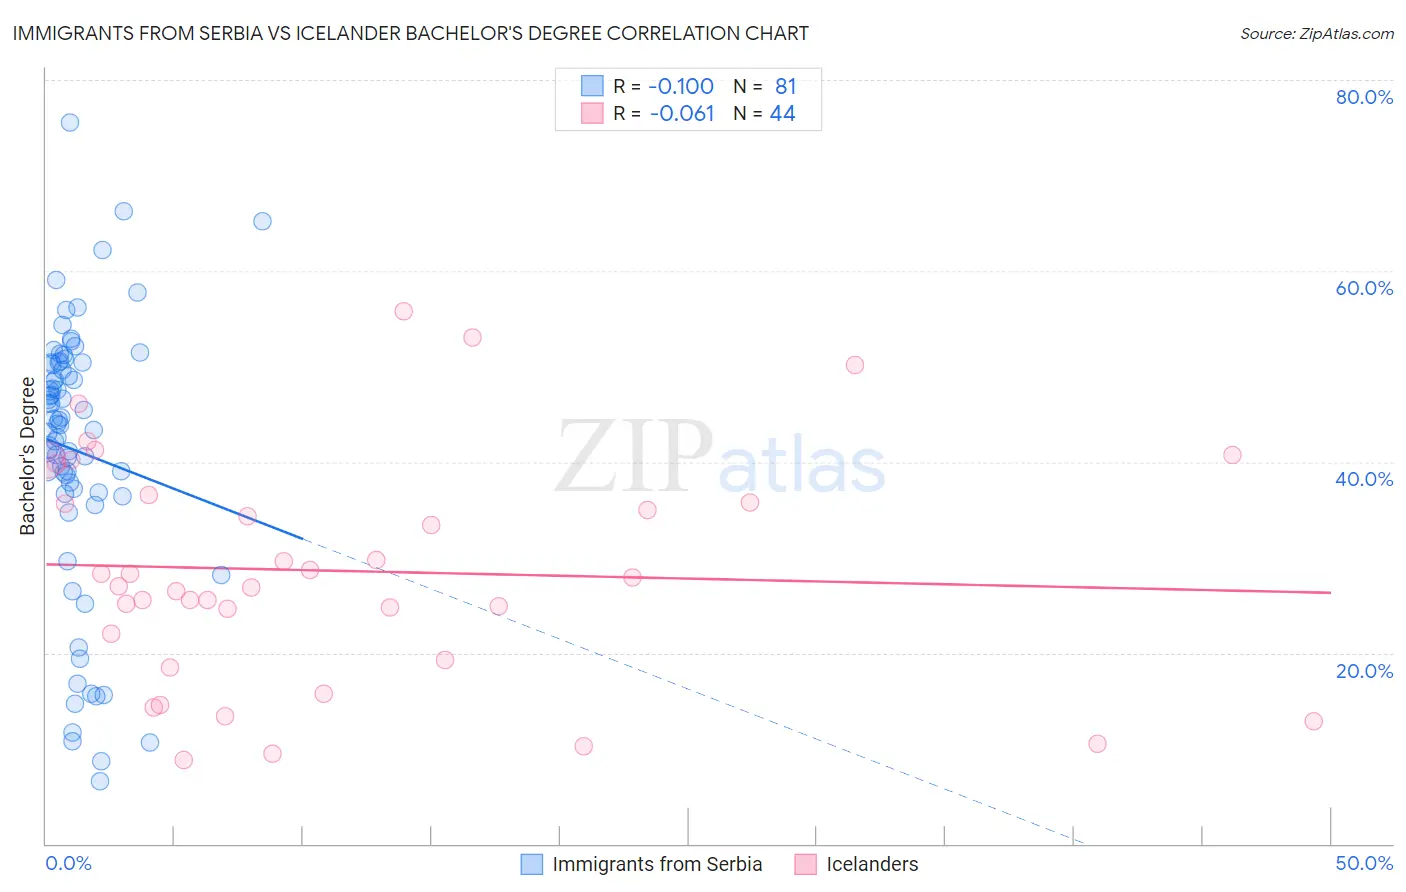
Immigrants from Serbia vs Icelander Bachelor's Degree Correlation Chart
The statistical analysis conducted on geographies consisting of 131,744,029 people shows a poor negative correlation between the proportion of Immigrants from Serbia and percentage of population with at least bachelor's degree education in the United States with a correlation coefficient (R) of -0.100 and weighted average of 44.1%. Similarly, the statistical analysis conducted on geographies consisting of 159,661,009 people shows a slight negative correlation between the proportion of Icelanders and percentage of population with at least bachelor's degree education in the United States with a correlation coefficient (R) of -0.061 and weighted average of 39.5%, a difference of 11.6%.
Bachelor's Degree Correlation Summary
| Measurement | Immigrants from Serbia | Icelander |
| Minimum | 6.6% | 8.8% |
| Maximum | 75.5% | 55.7% |
| Range | 69.0% | 47.0% |
| Mean | 41.1% | 28.6% |
| Median | 44.0% | 27.4% |
| Interquartile 25% (IQ1) | 36.7% | 20.6% |
| Interquartile 75% (IQ3) | 50.4% | 36.1% |
| Interquartile Range (IQR) | 13.6% | 15.5% |
| Standard Deviation (Sample) | 14.2% | 11.9% |
| Standard Deviation (Population) | 14.1% | 11.7% |
Similar Demographics by Bachelor's Degree
Demographics Similar to Immigrants from Serbia by Bachelor's Degree
In terms of bachelor's degree, the demographic groups most similar to Immigrants from Serbia are Immigrants from Bolivia (44.2%, a difference of 0.18%), Immigrants from Austria (44.2%, a difference of 0.19%), Paraguayan (44.0%, a difference of 0.19%), Immigrants from Czechoslovakia (44.0%, a difference of 0.24%), and Australian (44.0%, a difference of 0.34%).
| Demographics | Rating | Rank | Bachelor's Degree |
| Immigrants | Norway | 99.9 /100 | #49 | Exceptional 44.5% |
| Immigrants | Greece | 99.9 /100 | #50 | Exceptional 44.5% |
| Asians | 99.9 /100 | #51 | Exceptional 44.4% |
| Immigrants | Spain | 99.9 /100 | #52 | Exceptional 44.3% |
| Immigrants | Asia | 99.9 /100 | #53 | Exceptional 44.3% |
| Immigrants | Austria | 99.9 /100 | #54 | Exceptional 44.2% |
| Immigrants | Bolivia | 99.9 /100 | #55 | Exceptional 44.2% |
| Immigrants | Serbia | 99.9 /100 | #56 | Exceptional 44.1% |
| Paraguayans | 99.9 /100 | #57 | Exceptional 44.0% |
| Immigrants | Czechoslovakia | 99.9 /100 | #58 | Exceptional 44.0% |
| Australians | 99.9 /100 | #59 | Exceptional 44.0% |
| New Zealanders | 99.9 /100 | #60 | Exceptional 44.0% |
| South Africans | 99.8 /100 | #61 | Exceptional 43.6% |
| Immigrants | Kazakhstan | 99.8 /100 | #62 | Exceptional 43.4% |
| Immigrants | Europe | 99.8 /100 | #63 | Exceptional 43.4% |
Demographics Similar to Icelanders by Bachelor's Degree
In terms of bachelor's degree, the demographic groups most similar to Icelanders are European (39.5%, a difference of 0.17%), Pakistani (39.7%, a difference of 0.37%), Immigrants from Sudan (39.4%, a difference of 0.37%), Immigrants from Armenia (39.4%, a difference of 0.44%), and South American Indian (39.3%, a difference of 0.53%).
| Demographics | Rating | Rank | Bachelor's Degree |
| Sierra Leoneans | 92.2 /100 | #130 | Exceptional 40.1% |
| Italians | 91.9 /100 | #131 | Exceptional 40.1% |
| Taiwanese | 91.1 /100 | #132 | Exceptional 40.0% |
| Immigrants | Southern Europe | 91.1 /100 | #133 | Exceptional 40.0% |
| Assyrians/Chaldeans/Syriacs | 89.4 /100 | #134 | Excellent 39.8% |
| Luxembourgers | 89.1 /100 | #135 | Excellent 39.8% |
| Pakistanis | 88.2 /100 | #136 | Excellent 39.7% |
| Icelanders | 86.5 /100 | #137 | Excellent 39.5% |
| Europeans | 85.6 /100 | #138 | Excellent 39.5% |
| Immigrants | Sudan | 84.5 /100 | #139 | Excellent 39.4% |
| Immigrants | Armenia | 84.1 /100 | #140 | Excellent 39.4% |
| South American Indians | 83.6 /100 | #141 | Excellent 39.3% |
| Immigrants | North Macedonia | 81.6 /100 | #142 | Excellent 39.2% |
| Poles | 79.8 /100 | #143 | Good 39.1% |
| Immigrants | Afghanistan | 79.7 /100 | #144 | Good 39.1% |