Immigrants from Serbia vs Estonian Family Poverty
COMPARE
Immigrants from Serbia
Estonian
Family Poverty
Family Poverty Comparison
Immigrants from Serbia
Estonians
7.7%
FAMILY POVERTY
98.7/ 100
METRIC RATING
56th/ 347
METRIC RANK
7.5%
FAMILY POVERTY
99.4/ 100
METRIC RATING
37th/ 347
METRIC RANK
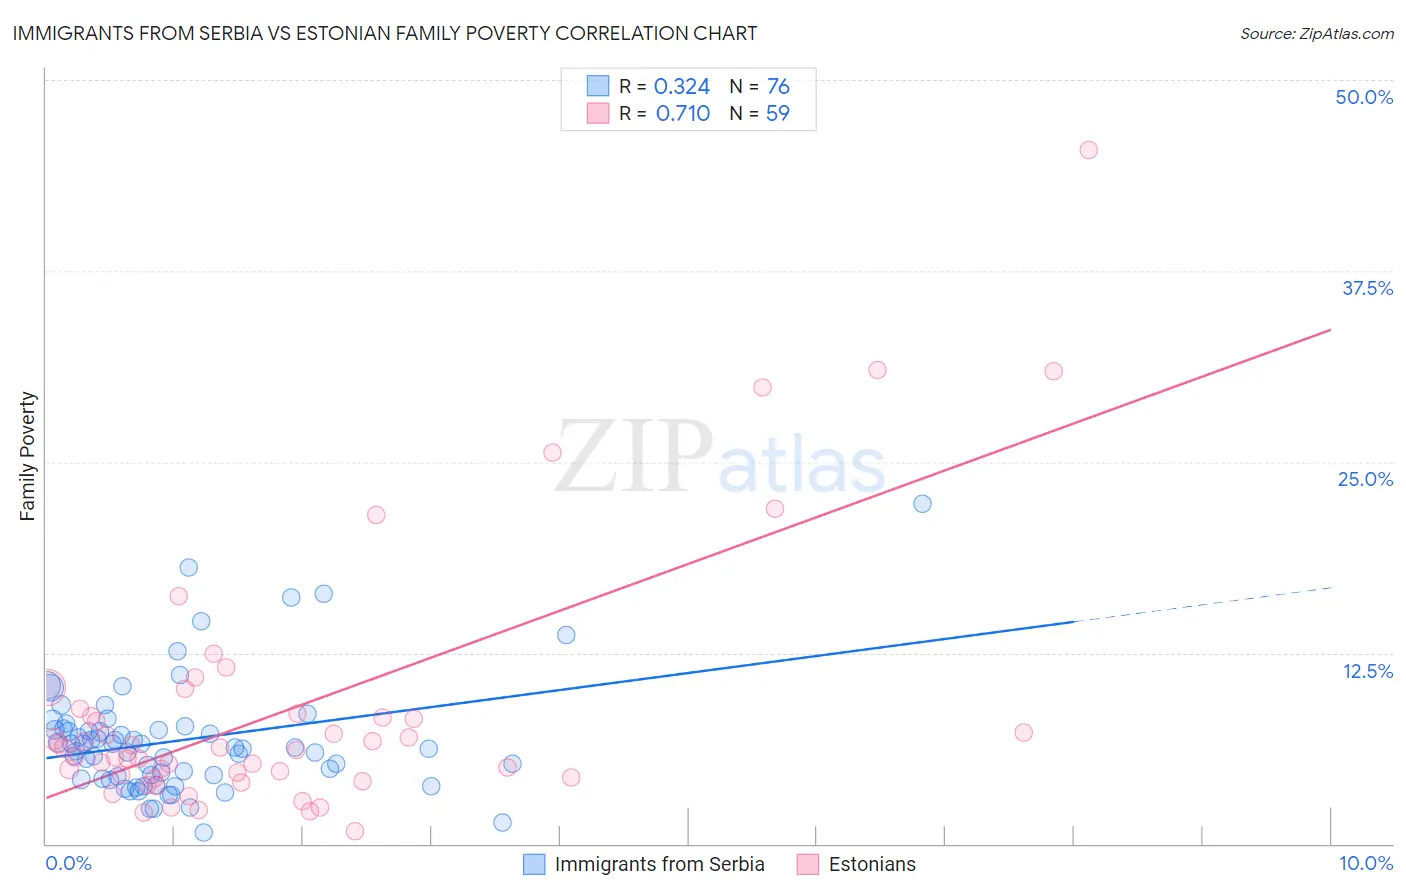
Immigrants from Serbia vs Estonian Family Poverty Correlation Chart
The statistical analysis conducted on geographies consisting of 131,659,331 people shows a mild positive correlation between the proportion of Immigrants from Serbia and poverty level among families in the United States with a correlation coefficient (R) of 0.324 and weighted average of 7.7%. Similarly, the statistical analysis conducted on geographies consisting of 123,321,798 people shows a strong positive correlation between the proportion of Estonians and poverty level among families in the United States with a correlation coefficient (R) of 0.710 and weighted average of 7.5%, a difference of 2.7%.
Family Poverty Correlation Summary
| Measurement | Immigrants from Serbia | Estonian |
| Minimum | 0.76% | 0.86% |
| Maximum | 22.2% | 45.5% |
| Range | 21.5% | 44.6% |
| Mean | 6.8% | 8.8% |
| Median | 6.3% | 6.3% |
| Interquartile 25% (IQ1) | 4.3% | 4.3% |
| Interquartile 75% (IQ3) | 7.5% | 8.6% |
| Interquartile Range (IQR) | 3.2% | 4.3% |
| Standard Deviation (Sample) | 3.8% | 8.5% |
| Standard Deviation (Population) | 3.8% | 8.4% |
Demographics Similar to Immigrants from Serbia and Estonians by Family Poverty
In terms of family poverty, the demographic groups most similar to Immigrants from Serbia are Immigrants from Eastern Asia (7.7%, a difference of 0.040%), Immigrants from Sweden (7.7%, a difference of 0.070%), Swiss (7.7%, a difference of 0.080%), Indian (Asian) (7.7%, a difference of 0.14%), and Immigrants from Moldova (7.7%, a difference of 0.30%). Similarly, the demographic groups most similar to Estonians are Turkish (7.5%, a difference of 0.17%), Bolivian (7.5%, a difference of 0.24%), Carpatho Rusyn (7.5%, a difference of 0.31%), Slovene (7.5%, a difference of 0.34%), and Immigrants from Australia (7.6%, a difference of 0.64%).
| Demographics | Rating | Rank | Family Poverty |
| Turks | 99.4 /100 | #36 | Exceptional 7.5% |
| Estonians | 99.4 /100 | #37 | Exceptional 7.5% |
| Bolivians | 99.3 /100 | #38 | Exceptional 7.5% |
| Carpatho Rusyns | 99.3 /100 | #39 | Exceptional 7.5% |
| Slovenes | 99.3 /100 | #40 | Exceptional 7.5% |
| Immigrants | Australia | 99.2 /100 | #41 | Exceptional 7.6% |
| Scandinavians | 99.1 /100 | #42 | Exceptional 7.6% |
| Immigrants | Austria | 99.1 /100 | #43 | Exceptional 7.6% |
| Germans | 99.0 /100 | #44 | Exceptional 7.7% |
| Okinawans | 98.9 /100 | #45 | Exceptional 7.7% |
| Tongans | 98.9 /100 | #46 | Exceptional 7.7% |
| Immigrants | Czechoslovakia | 98.9 /100 | #47 | Exceptional 7.7% |
| Immigrants | Sri Lanka | 98.9 /100 | #48 | Exceptional 7.7% |
| Immigrants | Bolivia | 98.9 /100 | #49 | Exceptional 7.7% |
| Immigrants | North Macedonia | 98.9 /100 | #50 | Exceptional 7.7% |
| Immigrants | Moldova | 98.8 /100 | #51 | Exceptional 7.7% |
| Indians (Asian) | 98.8 /100 | #52 | Exceptional 7.7% |
| Swiss | 98.8 /100 | #53 | Exceptional 7.7% |
| Immigrants | Sweden | 98.8 /100 | #54 | Exceptional 7.7% |
| Immigrants | Eastern Asia | 98.7 /100 | #55 | Exceptional 7.7% |
| Immigrants | Serbia | 98.7 /100 | #56 | Exceptional 7.7% |